That 2024 was the year for US equities will shock no one, with all eyes on the Magnificent Seven stocks. Investors have been transfixed by AI, and the US mega caps are believed best positioned to deliver them. Nevertheless, this run is more than a gargantuan “meme” run, with the likes of Amazon, Alphabet, and Nvidia delivering strong earnings, and consensus being that they will continue to do so. To hedge my bets, that’s not a recommendation either way: consensus has often been wrong footed, from the global financial crisis way back to Tulipmania.
However, UK fund investors’ 2024 can be summarised in the two tables below, ranking the top- and bottom-five Investment Association sectors, by performance and net flows. In terms of the performers, it’s perhaps a little surprising to see Financials in the top slot. That’s more than just banks, however (though banks have done well enough), encompassing the excitement around crypto and blockchain.
Table 1: Top and bottom IA sector by performance: one, three and five years

To December 31 2024
Table 1: Top and bottom IA sector by performance: one, three and five years
To December 31 2024
Source: LSEG Lipper
It’s not surprise, given the overall environment, that tech has also performed well. As has China, though it’s a white-knuckle ride, with many still considering it uninvestable, reflected in £2.26bn of redemptions over the year.
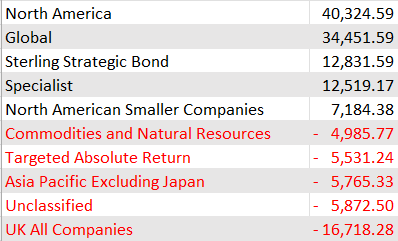
But, as said, the real story of the year is third-placed North America. It’s first place by flows, taking £40.32bn over the year. To put that in context, that’s almost half the total flows for the year by IA sector (£82.19bn).
At the opposite end of the table sits the once-mighty UK All Companies, having shed £16.72bn over the year. There may be glimmers at the end of this tunnel—one which has burrowed down for most of this century—as Lipper has noted significant inflows for UK equity funds over October and November, with valuations looking attractive relative to other developed markets, and to the UK market’s history. Bargain or value trap, however, are generally only obvious once the dust has not only settled but compacted. Another former market darling—Targeted Absolute Return—continues to suffer, with £5.53bn of outflows.
What, though, of the coming year—particularly for the current market darling, US equities? There is much speculation on what the change in administration means for investors. What follows is an attempt to pour cold water on such speculation.
For example, despite President Trump’s commitment to a “vibrant” coal sector over his first term, jobs in the industry fell by about a quarter, and production by about a third. On the other hand, US oil and gas production hit record highs during President Obama’s two terms and climbed even higher under President Biden.
Equity sectors: How green was my return profile?
How has this translated into the world of collective investments? Comparing two Lipper Global Classifications, the oil and gas-heavy Equity Sector—Energy, and the renewables-focused Equity Theme—Alternative Energy, over the administrations of Presidents Obama, Trump, and Biden (the latter to end-November 2024—see charts 1-3).
Chart 1: Lipper Global Classification Equity Sector—Energy versus Equity Theme—Alternative Energy under Obama
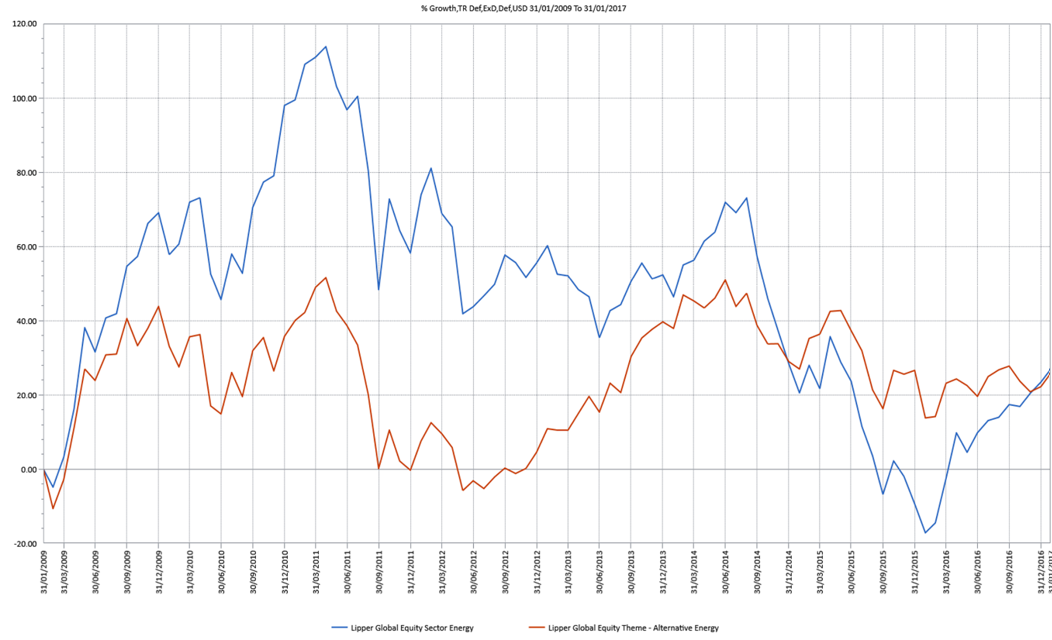
Chart 2: Lipper Global Classification Equity Sector—Energy versus Equity Theme—Alternative Energy under Trump
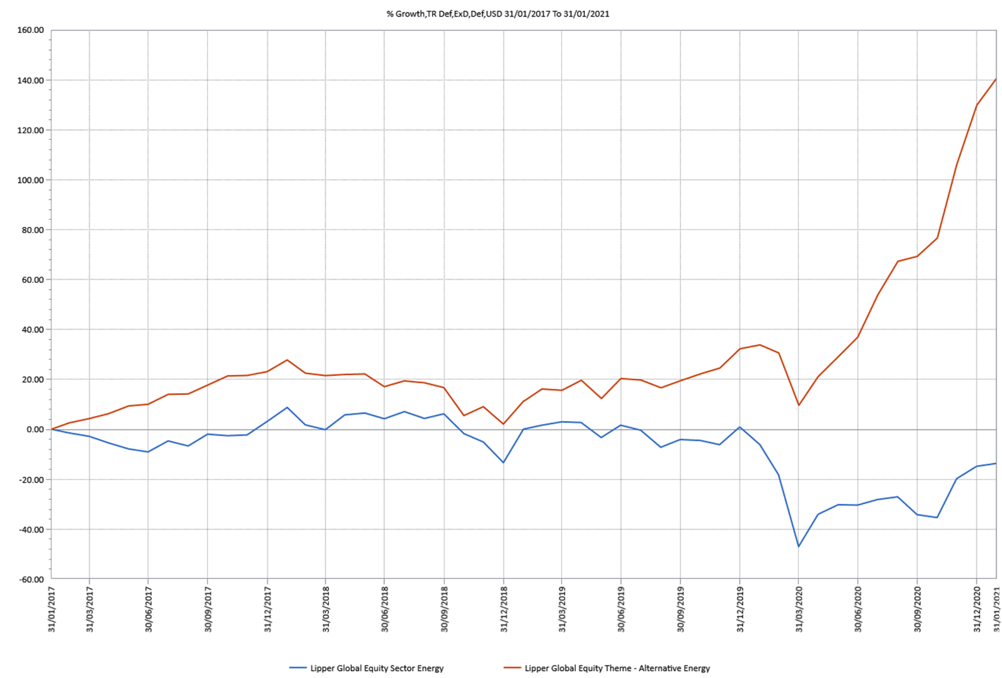
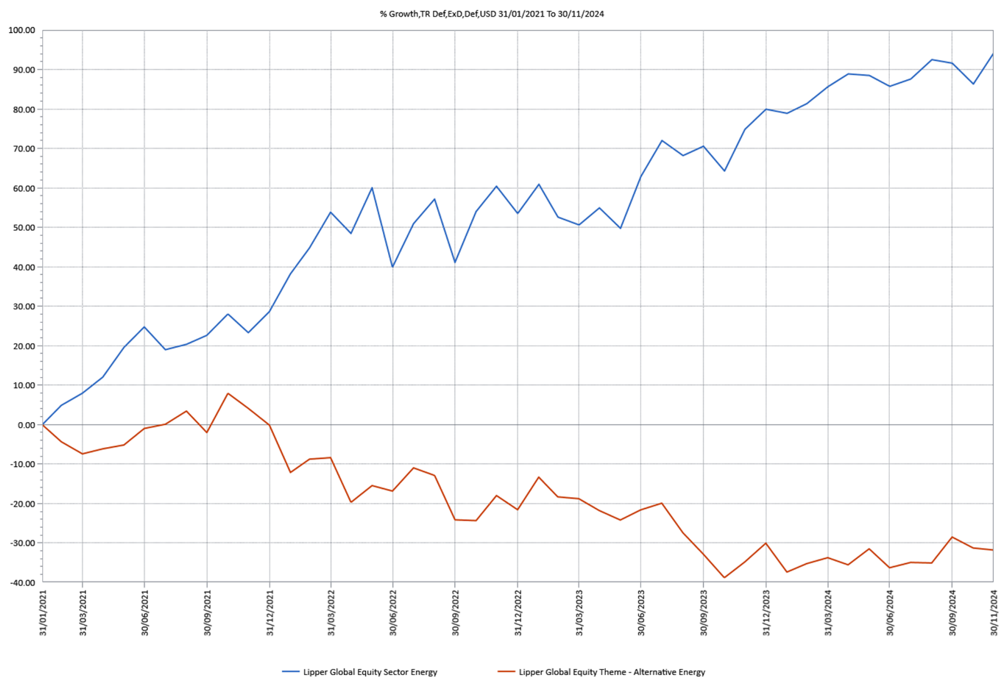
Chart 3: Lipper Global Classification Equity Sector—Energy versus Equity Theme—Alternative Energy under Biden
Source: LSEG Lipper
Over Obama’s two terms, the two classifications are much the same—although with a lot more volatility for Energy. Things couldn’t have been more different under Trump, as Alternative Energy roared ahead, with a return of 140.9%, compared to a loss of 13.7% for Energy. Then, under Biden, the trend reversed, as Alternative Energy fell by 31.75% and Energy returned 94.2% to November 2024.
The Biden administration had as little to do with the decline of alternative energy fund returns as Trump’s had to do with their ascendancy. It was just coincidence that the former came into office just as alternative energy returns reversed. In 2020, assets snowballed from the second quarter as alternative energy ETFs rallied hard following the first quarter’s COVID crisis. Alternative energy was then pummelled by a perfect storm: the return of “brown” stocks following the “vaccine bounce”, plus the drag of rising rates on sector’s heavily leveraged companies.
The structure of some alternative energy funds didn’t help either. For example, the index tracked by the world’s largest alternative energy ETF was initially composed of 30 mainly mid-cap stocks. Billions flowed into this ETF over a few short months in 2020. That resulted in a liquidity crunch. In response, the index constituents were increased in April 2021 to more than 80, but by then the damage had been done.
The Green and the Brown: fund returns by administration
There is no more direct a link between policy stances and returns when we look at US-domiciled sustainable versus conventional funds returns under the Trump and Biden administrations.
Table 3: US-domiciled equity and bond returns, Trump versus Biden: conventional verus sustainable
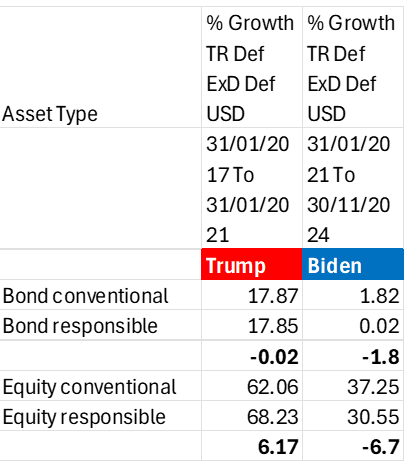
Source: LSEG Lipper
Across the fixed income piste, comparing sustainable to conventional, there’s little to call. There is more blue water separating the strategies on the equity front, however: responsible equity funds outperform by 6.17% under Trump, and underperform by 6.7% under Biden. Some of this will be attributable to the bond-like characteristics of renewables and the consequent hit they will have taken as rates spiked. But it will certainly not be the whole—or even the main—story given that most sustainable funds are relatively light in these assets. Rotations of market leadership by sector and style will have had a greater impact.
Bond shenanigans
Returning to the table 1, above, it’s clear that 2024 was a poor year for bonds, with four of the five bottom performers being fixed income sectors. However, the asset class overall has attracted money, encouraged by the prospect of lowering rates and the promise of a brighter tomorrow.
However, tomorrow is another day. As I write, UK government bond yields are climbing, dominating the UK financial pages. That’s not unique to the UK, and US policy under President Trump will likely continue to impact bond markets, potentially adding further upward pressure to yields.
But this is all in the terrain of “if”. It’s far from clear whether such policies are set in stone, or bargaining gambits—and, if the latter, what the end game looks like.
Based on recent history, it would be unwise to draw direct links between high-level policy and financial market outcomes, as many of the key levers are largely not under the control of central governments.
This article first appeared in Personal Finance Professional.
LSEG Lipper delivers data on more than 380,000 collective investments in 113 countries. Find out more.
The views expressed are the views of the author and not necessarily those of LSEG Lipper. This material is provided as market commentary and for educational purposes only and does not constitute investment research or advice. LSEG Lipper cannot be held responsible for any direct or incidental loss resulting from applying any of the information provided in this publication or from any other source mentioned. Please consult with a qualified professional for financial advice.