The total expense ratio (TER) of an ETF is a measure that sums up the management fee of the ETF plus all other expenses paid by the ETF. Therefore, an analysis of the Total Expense Ratios is more meaningful than a quick comparison of management fees. Even though the TER is a competitive measure, it has some flaws since there are costs which are not covered within the TER. In addition, there are costs for buying, selling, and holding an ETF. All the missing costs are displayed in the total costs of ownership (TCO). Since some of these costs depend on the investor, it doesn’t make sense to run a general analysis like this based on a fictional TCO.
Since the European ETF industry is highly competitive one would expect that the TERs in the European ETF segment tend to fall over time since a low management fee is seen as a competitive advantage when it comes to like-for-like products.
Therefore, it is no surprise that we see a somewhat similar pattern over the course of the years 2020 to 2024 for all asset types with the exception of alternative UCITS and “other” ETFs. That said, since alternative UCITS and ”other” ETFs are not like-for-like products one would expect that ETF promoters will separate themselves from the competition in this segment. This would allow them to charge higher fees on average. The same is true for mixed-assets ETFs and active ETFs, which means we may see a different TER pattern for the ETFs in these market segments.
In addition, it seems to be somewhat surprising that the average TER for bond and equity ETFs is relatively high since some of these products are charging their customers a management fee of less than 10 basis points (bps). That said, one needs also to bear in mind that only a few products charge such a low management fee, while the vast majority of ETFs charge higher management fees. This is especially true for active ETFs.
Graph 1: Total Expense Ratios by Asset Type 2020-2024 (in %)
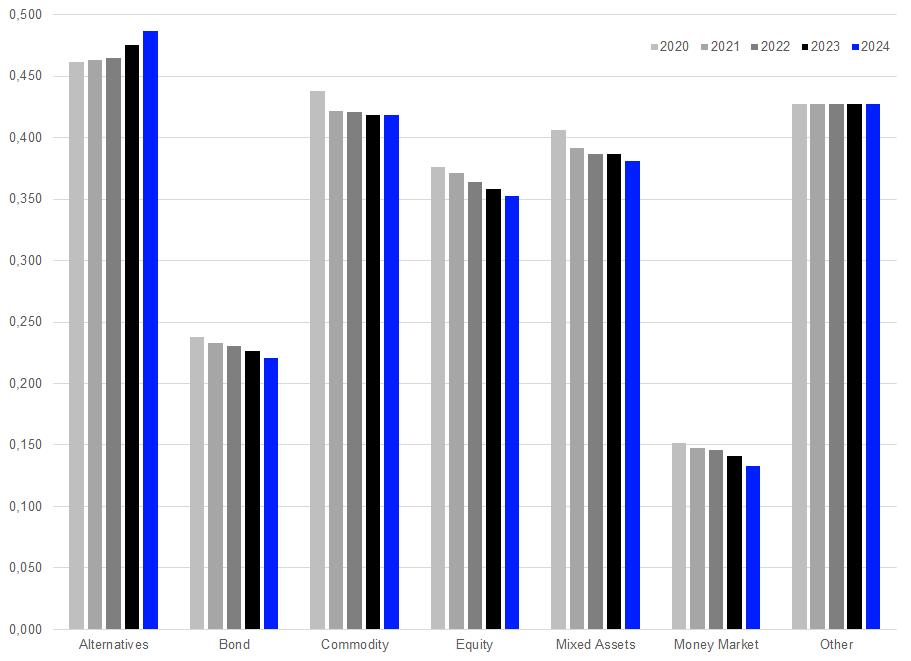
Source: LSEG Lipper
In addition, ETF promoters in Europe have launched a number of niche products which are investing in a specific market segment and/or are driven by a specific investment theme. These products are by nature not like-for-like products and enable the respective promoters to charge higher fees than for plain vanilla ETFs.
As to be expected, alternatives ETFs (0.487%) had the highest average TER at the end of the year 2024, bettered by “other” ETFs (0.427%), commodities ETFs (0.418%), mixed-assets ETFs (0.381%), equity ETFs (0.352%), bond ETFs (0.221%), and money market ETFs (0.133%).
This article is for information purposes only and does not constitute any investment advice.
The views expressed are the views of the author, not necessarily those of Lipper or LSEG.