February 2025 was another month with strong inflows (+€33.8 bn) for the European ETF industry. These flows were way above the rolling 12-month average (€23.5 bn) and might be an indicator that the European ETF industry is set to continue to grow above average over the course of 2025. In fact, if the European ETF industry is able to maintain net inflows at the same level for January and February for the rest of the year, it would hit an all-time high for annual inflows on a totally different level than before.
The inflows in the European ETF industry for February were driven by equity ETFs (+€24.3 bn), followed by bond ETFs (+€6.9 bn), money market ETFs (+€1.7 bn), commodities ETFs (+€0.6 bn), mixed-assets ETFs (+€0.2 bn), and alternatives ETFs (+€0.1 bn). These inflows occurred in a volatile market environment. That said, it is not unusual to witness strong inflows into ETFs when the markets are in limbo.
With regard to the above, the high estimated net flows in the equity segment might be looking like business as usual upon first viewing, as Equity Global (+€7.3 bn) was dominating the table of the 10 best-selling Lipper Global Classifications for the month. A closer view of the 10 best-selling Lipper classifications, however, shows that inflows for Equity Europe (+€3.0 bn) and Equity Eurozone (+€2.6 bn) continued the positive trend from January. These inflows are remarkable since European investors were reducing their exposure to the “old continent” over a long period of time. It was even more surprising to see Equity China as the fourth best-selling classification for February. This may signal a change in investor sentiment since investors saw China as an economy with structural challenges, especially in the real estate sector and with the achievement of economic growth, as the population is aging. That said, none of the structural challenges have changed so far, but the launch of the DeepSeek AI showcased that China is able to compete with the Western economies even on the highest technology levels.
Graph 1: European ETF Industry – Ten Best and Worst Lipper Global Classifcations by Estimated Net Sales
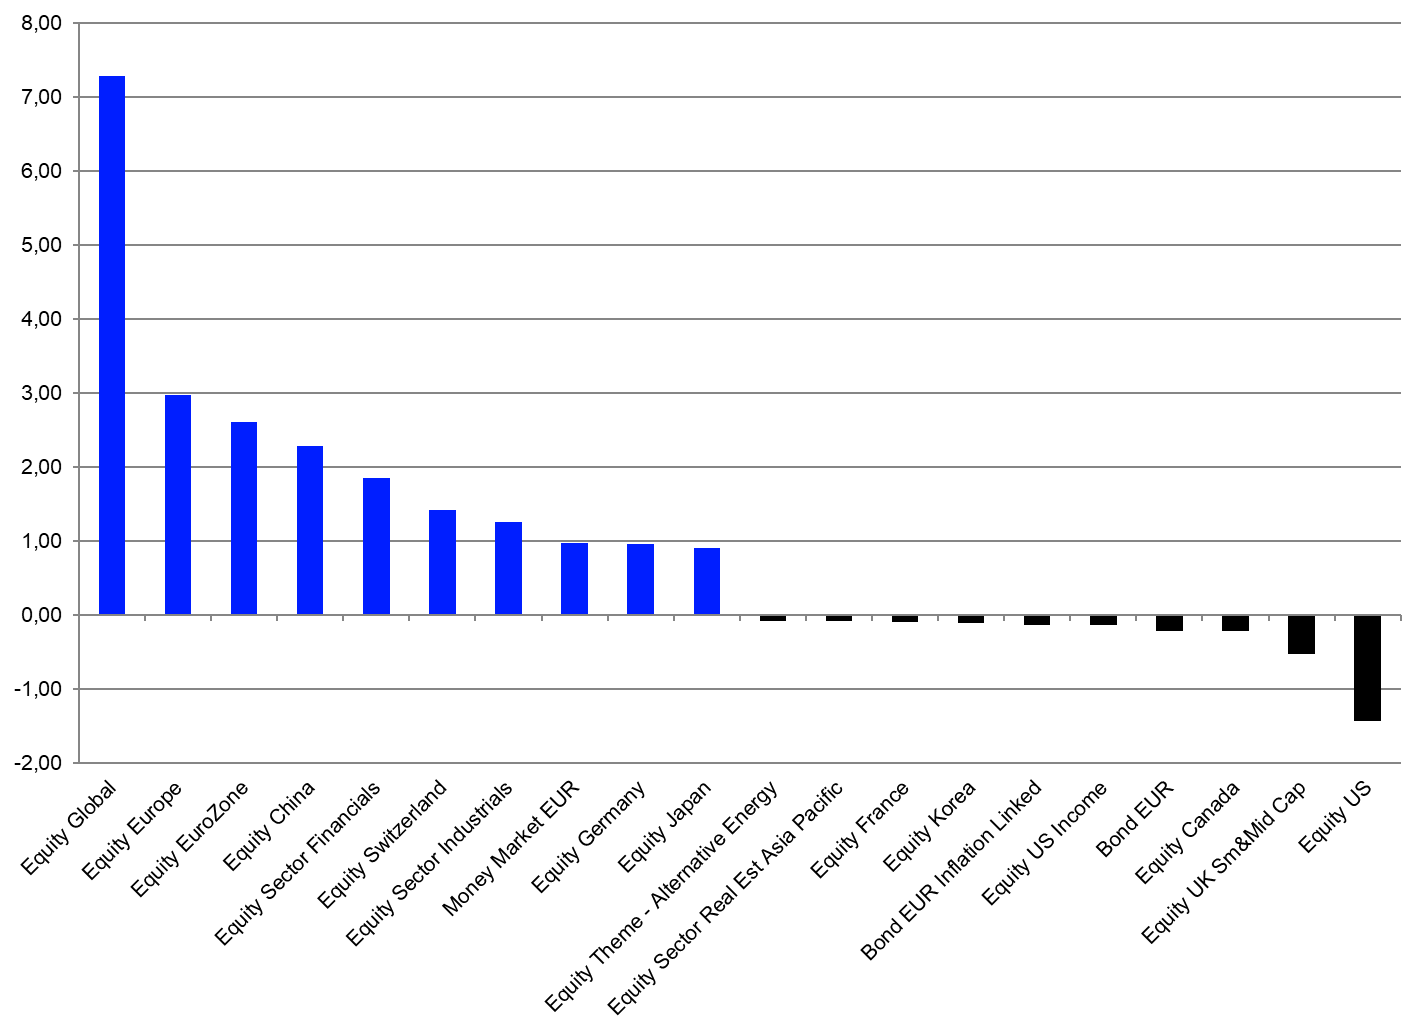
Source: LSEG Lipper
With all that in mind, the real surprise in the estimated fund flow trends was found on the other side of the table, as Equity U.S. (-€1.4 bn) faced the highest outflows for the month. As Equity U.S. was always among the three best-selling classifications in Europe for a long time, these outflows may indicate that European investors are concerned about the future growth of the U.S. economy, as the new tariff schemes may cause a global trade war. That said, the outflows from Equity U.S. were quite small compared to the overall assets under management held by ETFs classified as Equity U.S. (€568.8 bn). Nevertheless, the outflows from Equity U.S. are echoed by outflows from Equity U.S. Income (-€0.1 bn). Again, this a small number, but trends start often with small changes.
The main trend in the bond segment over the course of February can be seen in the flows by currency since European investors preferred all kind of U.S. dollar bonds over euro bonds. That said, no bond classification made it on the table of the 10 best-selling Lipper classifications for the month. On the other side of the table, only Bond EUR Inflation Linked (-€0.1 bn) was on the table of the 10 Lipper classifications with the highest outflows. Without taking the absolute number into consideration, these outflows could be interpreted that European investors adjust their portfolios to lower inflation expectations.
In addition to this, we once again witnessed further inflows into Money Market EUR (+€1.0 bn) for the month. However, one needs to bear in mind that the flows into money market products might be a result of the still somewhat inverted yield curves as investors may wanted to harvest higher interest rates with lower duration risk as in the bond segment.
This article is for information purposes only and does not constitute any investment advice.
The views expressed are the views of the author, not necessarily those of LSEG.


