In line with the general global trend regarding fund flows, the South African fund industry enjoyed estimated net inflows of $4.3 bn over the course of the first half of 2020. These inflows were kind of a surprise since the outbreak of the coronavirus pandemic and the global lockdowns of economies led to a massive drawdown on the equity markets during Q1 2020. This was countered, however, by very large cushioning packages of governments and quantitative easing programs of central banks around the globe. Nevertheless, the first half of 2020 was a tough time for the South African fund industry and one would not expect to see net inflows into mutual funds.
Assets Under Management in the South African Fund Industry
Assets under management in the South African fund industry increased from $190.8 bn (December 31, 2019) to $155.8 bn (June 30, 2020). This increase was driven by the performance of the underlying markets, which contributed a negative $39.4 bn, while net sales contributed inflows of $4.3 bn. It is noteworthy that the impact of the market performance is also driven by the conversion from the South African rand to the U.S. dollar (the standard currency for this report).
Graph 1: Assets Under Management in the South African Fund Industry (U.S. Dollar Billions)
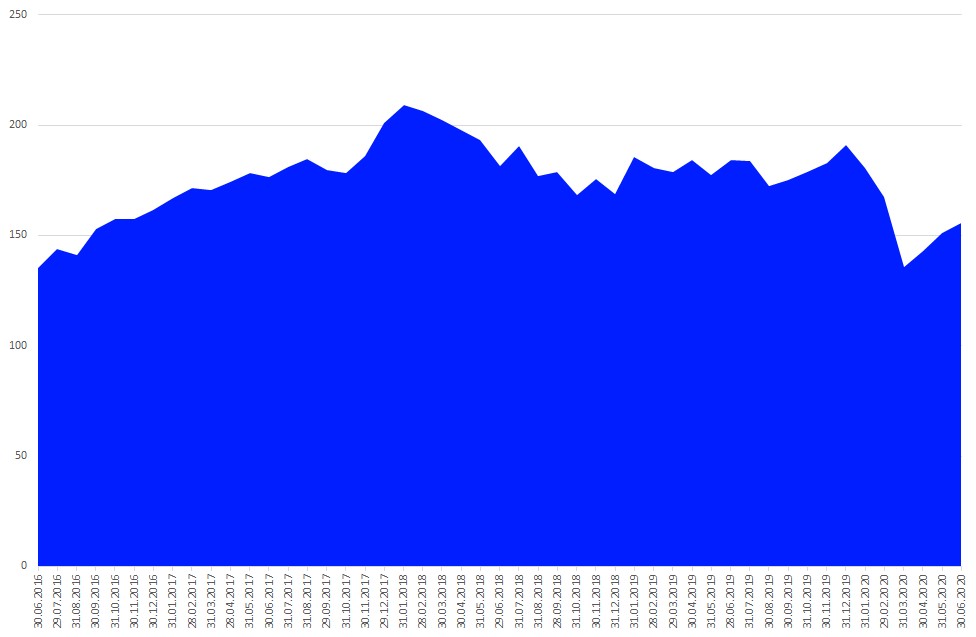
Source: Refinitiv Lipper
Mixed-assets funds ($71.8 bn) were the asset type with the highest assets under management at the end of June 2020, followed by equity funds ($33.5 bn), bond funds ($25.3 bn), money market funds ($21.9 bn), alternatives funds ($2.7 bn), commodities funds ($0.5 bn), and real estate funds ($0.1 bn).
Graph 2: Market Share by Asset Type (June 30, 2020)

Source: Refinitiv Lipper
South African Fund Flow Trends H1 2020
Generally speaking, the first half of 2020 was a tough period, with split results for asset managers in the South African fund management industry. Nevertheless, the year 2020 can so far be generally considered as positive since mutual funds (+$4.3 bn) enjoyed net inflows.
Graph 3: Estimated Net Sales by Asset Type H1 2020 (U.S. Dollar Billions)
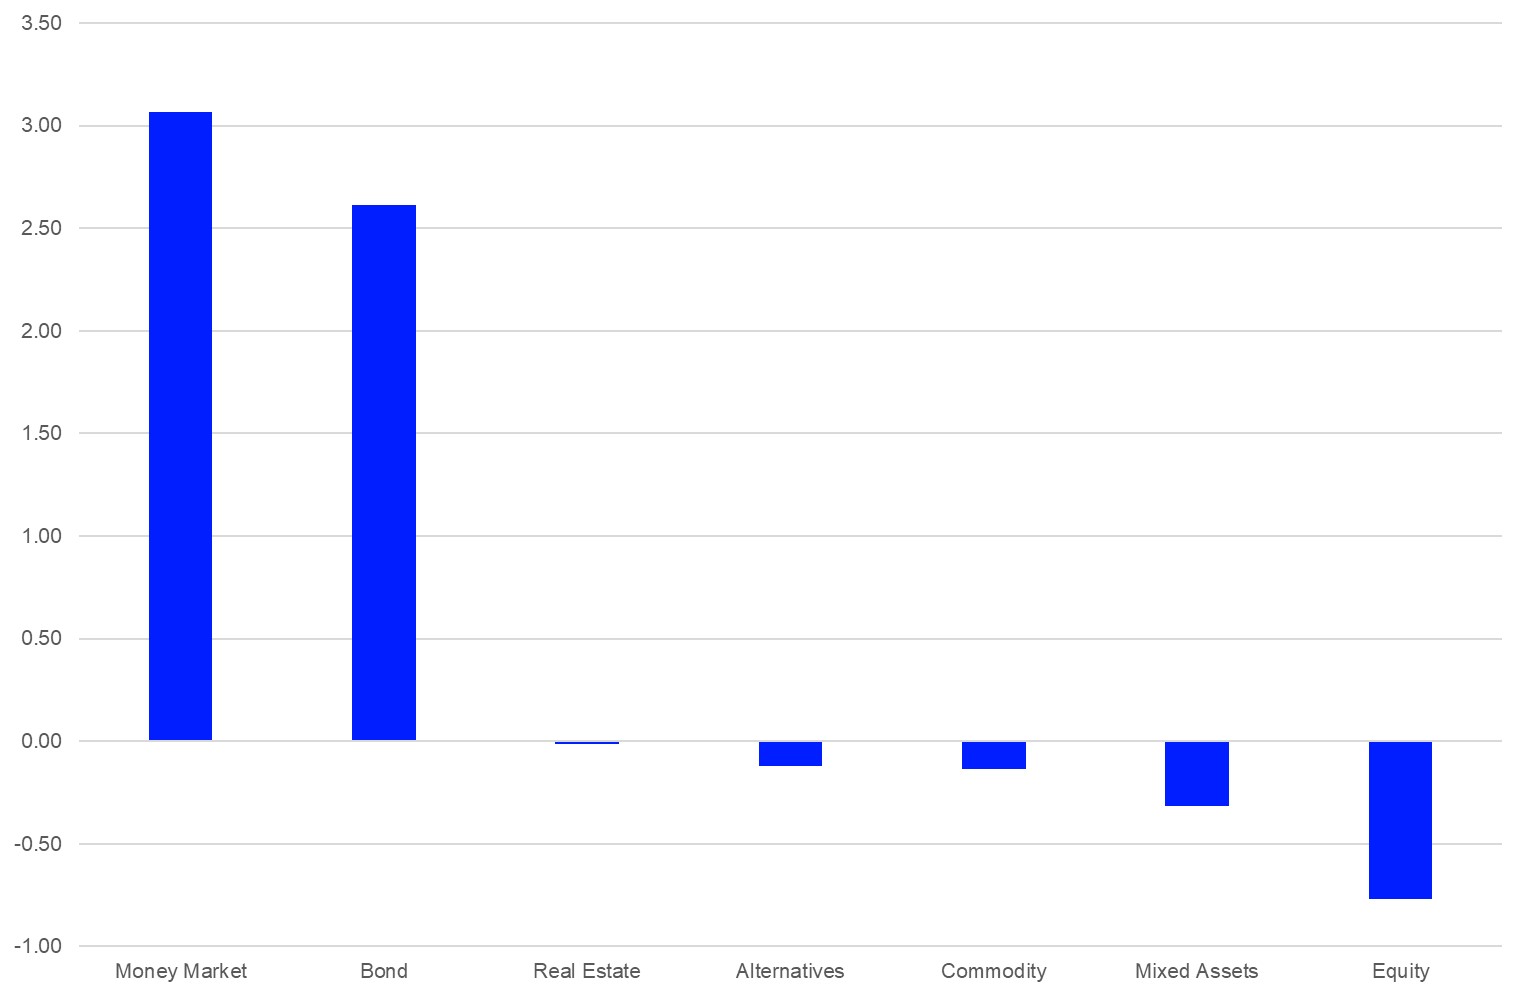
Source: Refinitiv Lipper
Fund Flows by Asset Type*
A more detailed view by asset type reveals that only two of the seven asset types covered in this report enjoyed inflows over the course of the first half of 2020. Money market funds (+$3.1 bn) was the best-selling asset type, followed by bond funds (+$2.6 bn), while real estate funds (-$0.01 bn), alternatives funds (-$0.1 bn), commodities funds (-$0.1 bn), mixed-assets funds (-$0.3 bn), and equity funds (-$0.8 bn) faced estimated outflows over the first half of 2020.
Fund Flows by Sectors*
Money Market ZAR (+$3.1 bn) was the best-selling sector overall for the first half of 2020, followed by Bond ZAR (+$2.6 bn), Mixed Asset ZAR Conservative (+$0.3 bn), Equity South Africa (+$0.2 bn), and Mixed Asset ZAR Aggressive (+$0.2 bn).
Graph 4: The 10 Best and Worst Selling Sectors H1 2020 (U.S. Dollar Billions)
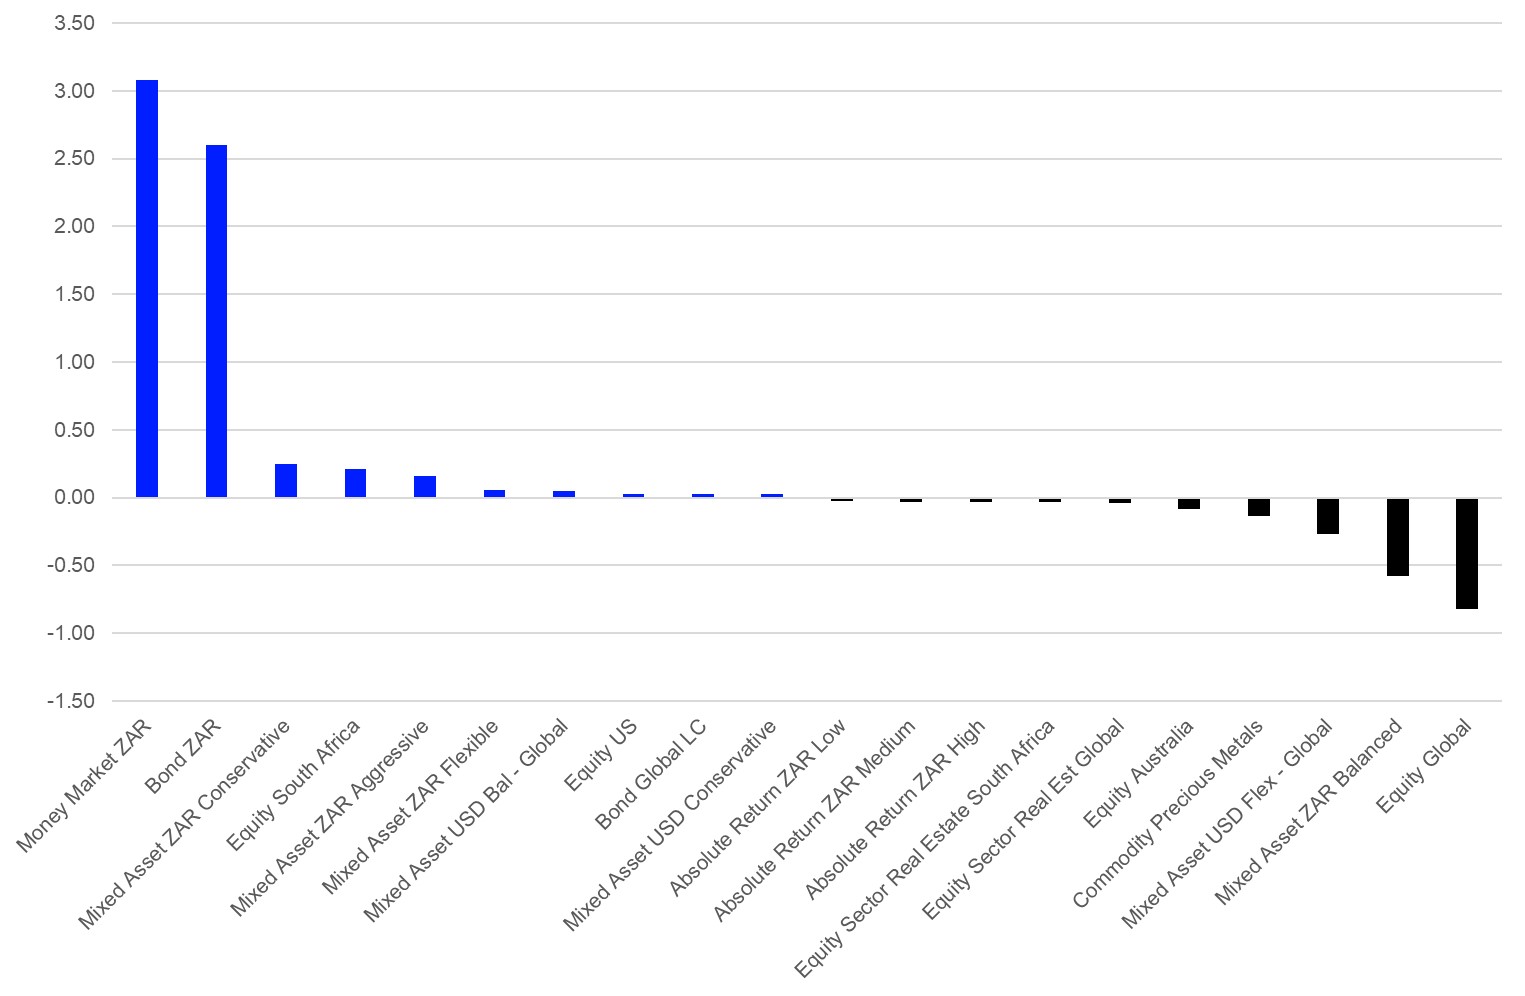
Source: Refinitiv Lipper
At the other end of the spectrum, Equity Global (-$0.8 bn) suffered the highest estimated net outflows overall, bettered by Mixed Asset ZAR Balanced (-$0.6 bn), Mixed Asset USD Flexible Global (-$0.3 bn), Commodity Precious Metals (-$0.1 bn), and Equity Australia (-$0.1 bn).
*Please note that Refinitiv Lipper launched an updated Lipper Global Classification Scheme in May 2019, which caused some shifts with regard to the assets under management and the estimated net flows within the single asset types and/or sectors. Please visit our website, to learn more about the new Lipper Global Classifications.
Fund Flows by Promoters
Ninety One, with net sales of $1.2 bn, was the best-selling fund promoter for the first half 2020 overall, ahead of Nedgroup (+$1.1 bn), Stanlib (+$0.4 bn), ABSA (+$0.2 bn), and Ashburton (+$0.2 bn).
Graph 5: Ten Best Selling Promoters H1 2020 (U.S. Dollar Billions)
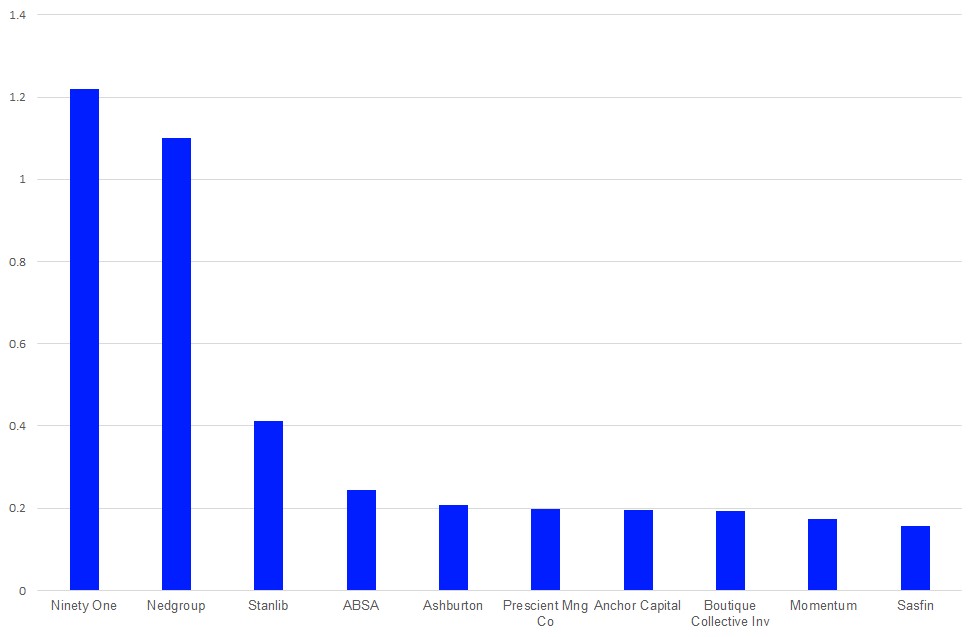
Source: Refinitiv Lipper
The views expressed are the views of the author, not necessarily those of Refinitiv.

