December 31 is commonly used by investors around the globe to analyze the performance of their investments. This review shall guide investors IN the evaluation of their funds by showing them how the average equity, bond, or mixed-assets fund has performed in its respective peer group (Lipper European Classification).
The year 2021 was a difficult year for investors around the globe, as the returns of many peer groups and their respective funds have been driven by the development of the underlying currencies against the euro. Therefore, the performance of a number of Lipper European Classifications does only partly reflect the developments of the underlying markets.
While the first part of the review is showing the 10 best and worst performing Lipper European Classifications for bond, equity, and mixed-assets funds, the graphs in the appendix show the performance of all peer groups for the respective asset types.
Please read the methodology section for more information.
Methodology
As Lipper does only calculate performance averages on a global level, the methodology used to calculate the Lipper Global Classifications averages for the European fund market has been adapted for this fund universe. For the respective calculations, all primary and convenience share classes from mutual funds, ETFs, closed-end funds, and investment trusts with the status “active” as of January 7, 2022, which were at least registered for sale in one of the following European countries (Austria, Belgium, Bulgaria, Cyprus, Czech Republic, Denmark, Estonia, Finland, France, Germany, Greece, Hungary, Ireland, Italy, Latvia, Liechtenstein, Lithuania, Luxembourg, Monaco, the Netherlands, Norway, Poland, Portugal, Romania, Slovakia, Slovenia, Spain, Sweden, Switzerland, Turkey, and the UK) were taken into consideration. The average returns are calculated as simple averages by adding up the returns from all share classes and dividing them by the respective number of share classes within each Lipper Global Classification. As this study is covering Europe as target market, all calculations are made in euros.
Lipper European Bond Classifications
A closer view on performance of the different bond classifications shows that currency effects and specific risks/investment objectives like inflation linked or high yield bonds were driving the results within the bond peer groups. One example for this are global high yield bonds. While Bond Global High Yield denominated in GBP (+10.57%) was the second-best performing Lipper European Bond Classification, Bond Global High Yield denominated in JPY (-6.12%) was the third worst performing peer group.
Graph 1: The 10 Best and Worst Performing Lipper European Bond Classifications (December 31, 2020 – December 31, 2021)
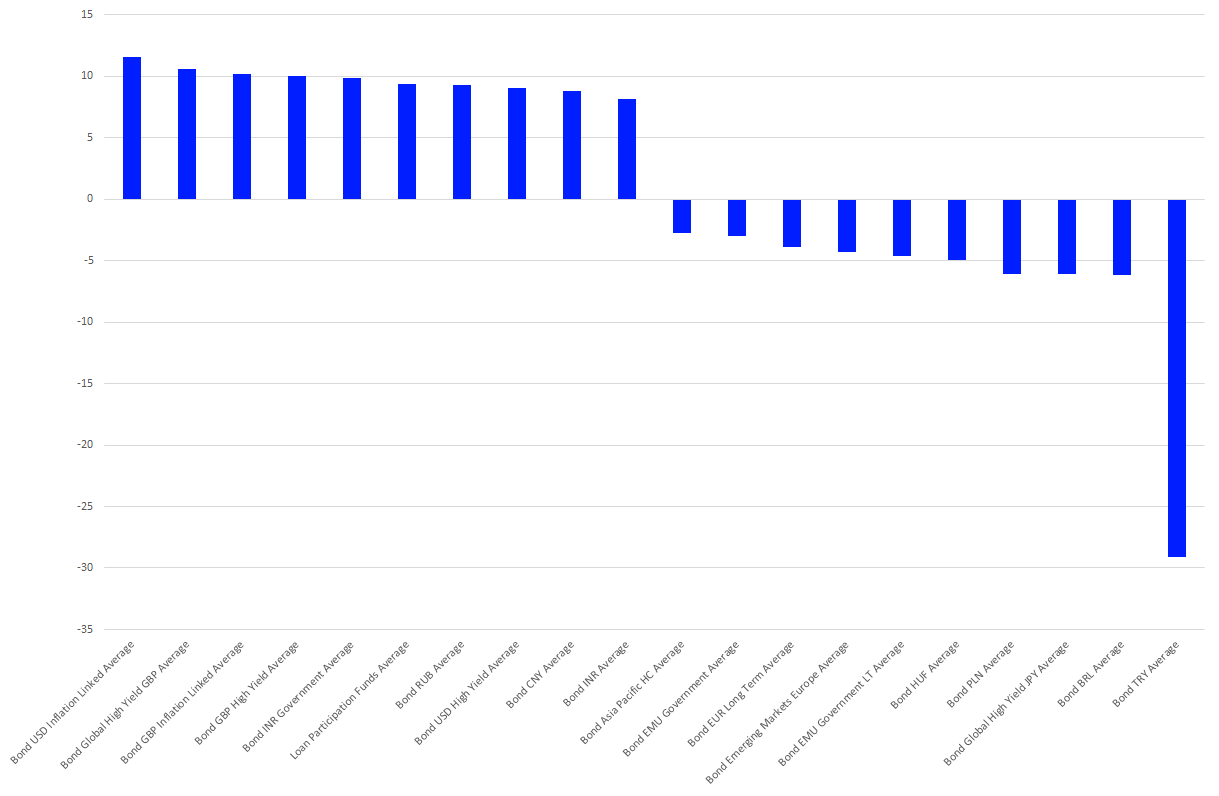
Source: Refinitiv Lipper
Lipper European Equity Classifications
When it comes to equity funds, we often see that exotic markets are dominating the tables of the best performing equity markets over the course of a calendar year. Therefore, it is not surprising that the performance table for equity funds over the course of the year 2021 is dominated by Equity Vietnam (+60.78%), followed by Equity UAE (+52.31%) and Equity India Small and Mid-Cap (+48.94%).
The same is somewhat true for the peer groups on the other side of the table. That said, the performance of the worst performing Lipper European Classification, Equity Turkey (-19.91%), was massively impacted by the decline of the Turkish lira against the euro, while the underlying currency had only a minor effect on the second (Equity Brazil -16.79%) and third (Equity Brazil Small and Mid-Cap -9.97%) worst performing equity peer groups.
Graph 2: The 10 Best and Worst Performing Lipper European Equity Classifications (December 31, 2020 – December 31, 2021)

Source: Refinitiv Lipper
Lipper European Mixed-Assets Classifications
Within the mixed-assets segment it is somewhat surprising that target maturity products were dominating the performance table for the year 2021. That said, these funds are often buying long-term bonds, which do somewhat match the maturity target of the fund. These bonds may help the respective funds to outperform their peers in a year with falling or stable interest rates, while they will lead to an underperformance in years with increasing interest rates. In addition to this, the performance table does also reflect the currency impact, as the majority of the 10 best performing Lipper European Classifications were denominated in currencies with a positive performance compared to the euro. Meanwhile, a number of the worst performing mixed-assets peer groups were denominated in currencies with a negative performance compared to the euro.
Graph 3: The 10 Best and Worst Performing Lipper European Mixed-Assets Classifications (December 31, 2020 – December 31, 2021)

Source: Refinitiv Lipper
The views expressed are the views of the author, not necessarily those of Lipper or Refinitiv.
Report Topics
Uncategorized

