Since 1965, the FTSE All Share Index has increased during every tenure of government. If we use a light-hearted assumption that prior stock market performance is an indicator of future performance, the markets would welcome a Conservative win in today’s U.K. election. Using a logarithmic scale, the most notable increase came during 1979-1997, where the index increased 10 times in value during a Conservative government. Since 2010, the index has also risen approximately 1.5x with Conservatives in power. Labour was in charge during the tech bubble and ’08 financial crisis, which lead to the sideways performance during this period.
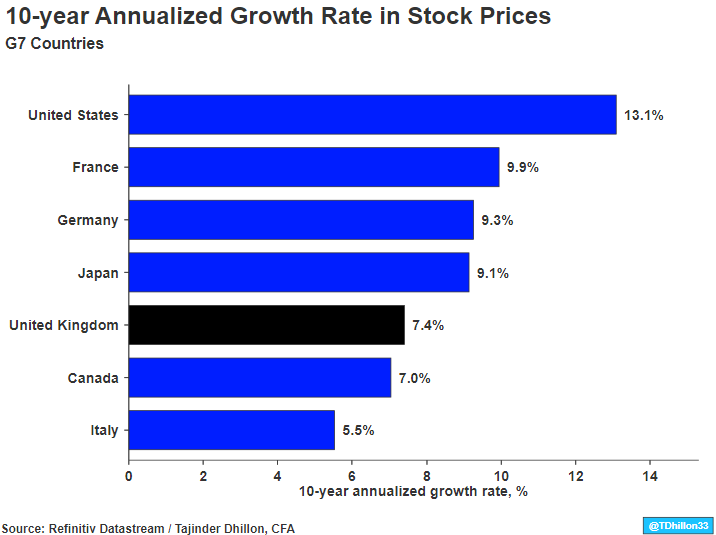
Exhibit 1 shows annualized stock price performance over the last 10 years using Datastream Global Indices. U.K. equities have grown at an annualized rate of 7.4% compared to 13.1% of the U.S.
Within the U.K, banks have significantly underperformed the broader index over the last 10 years. Within the FTSE 100, Standard Chartered, Barclays, and Royal Bank of Scotland have declined 4.4%, 2.1%, and 1.8% respectively on an annualized basis over this time period. Both HSBC Holdings and Lloyds Banking Group have increased 2.8% on an annualized basis, in comparison to the broader FTSE 100 which has increased 7.2%.
Exhibit 1: Equities Performance over 10 years