U.K. large-cap equities continue to be resilient in the face of multiple headwinds, as the FTSE 100 is the third strongest performer year-to-date. The index is up 4.7%, only behind to the Brazil Bovespa Index (+9.1%) and OMX Oslo All-Share Index (+10.5%).
We note possible reasons for relative outperformance in a prior note which include index composition (higher tilt towards value), attractive valuations and higher dividend yields (A Case for U.K. Equities: Valuation and Yields Look Attractive, March 31, 2022). However, we note that small-cap companies have underperformed as the FTSE 250 has declined 9.2% year-to-date in the face of a weakening domestic economy.
In this note, we follow-up by looking underneath the hood and taking a closer look at the individual sectors to see which sectors are in favour from both a valuation and analyst sentiment perspective.
Using Refinitiv Datastream, we look at the forward P/E ratio for each sector within the FTSE 350 Index and compare it to the 10-year average while also showing the high-low range to provide a complete view on current valuation levels. As shown in Exhibit 1, the overall index has a forward P/E of 11.5x which is below the 10-year average of 13.5x.
- Product Insight: To retrieve the forward P/E for the FTSE 350, use mnemonic @:UKFT350 in conjunction with datatype A12PE (i.e. @:UKFT350(A12PE)).
Exhibit 1: FTSE 350 Forward P/E

Utilities are currently most expensive when compared to its 10-year average and is trading at a 17.0% premium (17.1x vs. long-term average of 14.6x). Health Care is the second most expensive sector trading near a 10-year high of 17.6x vs. a long-term average of 15.4x, a 13.9% premium.
Industrials, Consumer Discretionary, and Consumer Staples are all fairly valued while Telecommunication Services and Financials are under valued relative to its long-term average.
However, investors will find the largest discounts in Energy and Materials who are both trading well below its long-term average. The FTSE 350 Energy sector is the leading performer over the last year, up 60.5% (total-return), yet has a forward P/E of 6.3x, well below its long-term average of 12.2x and is trading at a 48.8% discount.
The Materials sector trades at a 7.9x forward P/E, resulting in a 35% discount to its long-term average and well below the 10-year high of 26.1x.
EPS Estimate Revisions
Using data from Exhibit 1, we overlay analyst estimate revisions data to gauge which sectors are seeing upward revisions vs. those that are overvalued and continue to get downgraded.
Using the I/B/E/S Global Aggregates database in Refinitiv Datastream, we display the 1-month (blue bar) and 3-month (grey bar) percent changes in the forward 12-month EPS estimate.
The black bar in Exhibit 2 represents the forward 12-month P/E ratio for each sector and overall index. Technology is most expensive relative to the overall market with a forward P/E of 22.6x followed by Health Care (17.6x), Utilities (17.1x), Industrials (15.6x), Consumer Discretionary (15.2x), and Consumer Staples (14.5x).
Many of the sectors that are most expensive are also seeing analysts downgrade forward 12-month EPS estimates. Analysts have downgraded EPS estimates for the Technology sector by 5.7% over the last month. Industrials, Consumer Discretionary and Consumer Staples have also seen their EPS estimates decline over the last month.
Sectors that are most expensive relative to the overall market may face larger downgrades as investors look towards value-oriented sectors.
Exhibit 2: FTSE 350 EPS Revisions and Forward P/E

Conversely, we see strong upward revisions for both the Materials and Energy sector given stronger prices across the commodity complex. The Materials sector has seen the strongest upward EPS revisions over the last month, increasing 18.6%. When looking at the last three months, the forward EPS estimate has been revised upwards by a whopping 36.3%. The Energy sector has also seen very strong revisions over the last month and three months, increasing 11.4% and 31.4% respectively.
We repeat this analysis in Exhibit 3, except we move away from earnings and look at top-line sales. We see a more balanced picture as half of the sectors trade both above and below the overall FTSE 350 12-month forward P/Sales ratio.
Exhibit 3: FTSE 350 Sales Revisions and Forward P/S
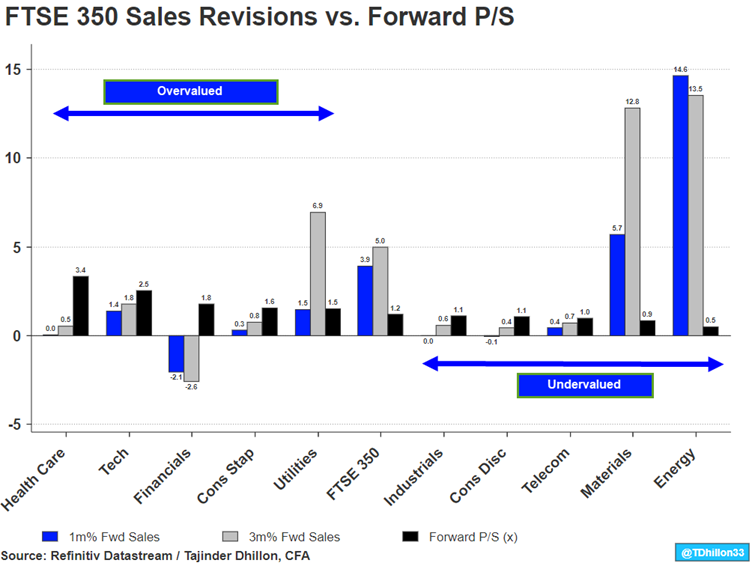
The FTSE 350 has a forward P/Sales ratio of 1.2x and it appears that analysts are bullish in top-line expectations. Revenue estimates for the overall index have increased by 3.9% over the last month and 5.0% over the last three months.
- Product Insight: To retrieve the forward P/S for the FTSE 350, use mnemonic @:UKFT350 in conjunction with datatype AS12PS (i.e. @:UKFT350(AS12PS)).
Financials are the only sector to see downgrades in revenue expectations which may be surprising given the higher interest rate environment, a positive for net interest margins. However, higher volatility may limit investment banking activity while new loans to consumers may be challenging given record low levels in consumer confidence.
Perhaps unsurprisingly, Materials and Energy have seen the largest upward revisions in sales estimates, yet both sectors have the lowest forward P/Sales ratio. Note that when keeping prices constant, higher estimate revisions will yield a lower forward multiple.
Materials has seen its forward revenue estimates increase by 5.7% over the last month in comparison to a 14.6% increase for the Energy sector.
The FTSE 100 comprises of many multinational companies that may see a tailwind in revenues off the back of a stronger U.S. dollar. The U.S. dollar index is at a two-year high which will benefit various index constituents who generate a significant portion of revenue abroad.
Refinitiv Datastream – Financial time series database which allows you to identify and examine trends, generate and test ideas and develop viewpoints on the market.