Economists will often borrow theories and techniques, devised by other disciplines, to better advance their understanding of the world. One clear example of this is the so-called ‘gravity model of trade’. As physicists will tell you, Newton’s law of universal gravitation states that the gravitational pull exerted between two objects is proportional to the mass of each object, and it is inversely proportional to the distance between them. In turns out that something similar is true regarding the flow of global trade — the larger two economies are, and the shorter the distance between them, the more they tend to trade. This is what gravity models of trade tend to conclude. However, that might not always been the case.
There are plenty of other factors that also determine trade, such as trade deals and the prevailing level of tariffs. As geopolitical tensions rise between the US and China, we might have expected that the US (and its close political and military allies) would raise tariffs on countries with whom they are less closely aligned, in a political sense. In other words, geopolitical (as opposed to geographic) distance might become a more important determinant when observing the pattern of global trade.
We can see what that might look like in the chart below. The x-axis measures geopolitical distance by observing whether countries have mirrored US foreign policy decisions during recent geopolitical disputes. (A score of 0 implies that a country supported the US in all disputes examined, while a value of 200 would indicate that a country has opposed US decisions in all instances). The two bold lines in the chart below show combinations of points where the US would be indifferent in its choice of trading partner, controlling for the sizes of their economies. The grey line shows a ‘low-tension state’ for the world (where the predominant factor that matters is geographic distance) while the orange line shows an hypothesized ‘state’, where geopolitical distance would matter too. Over time, and as global tensions rise, we might have expected the US to move towards the blue line.
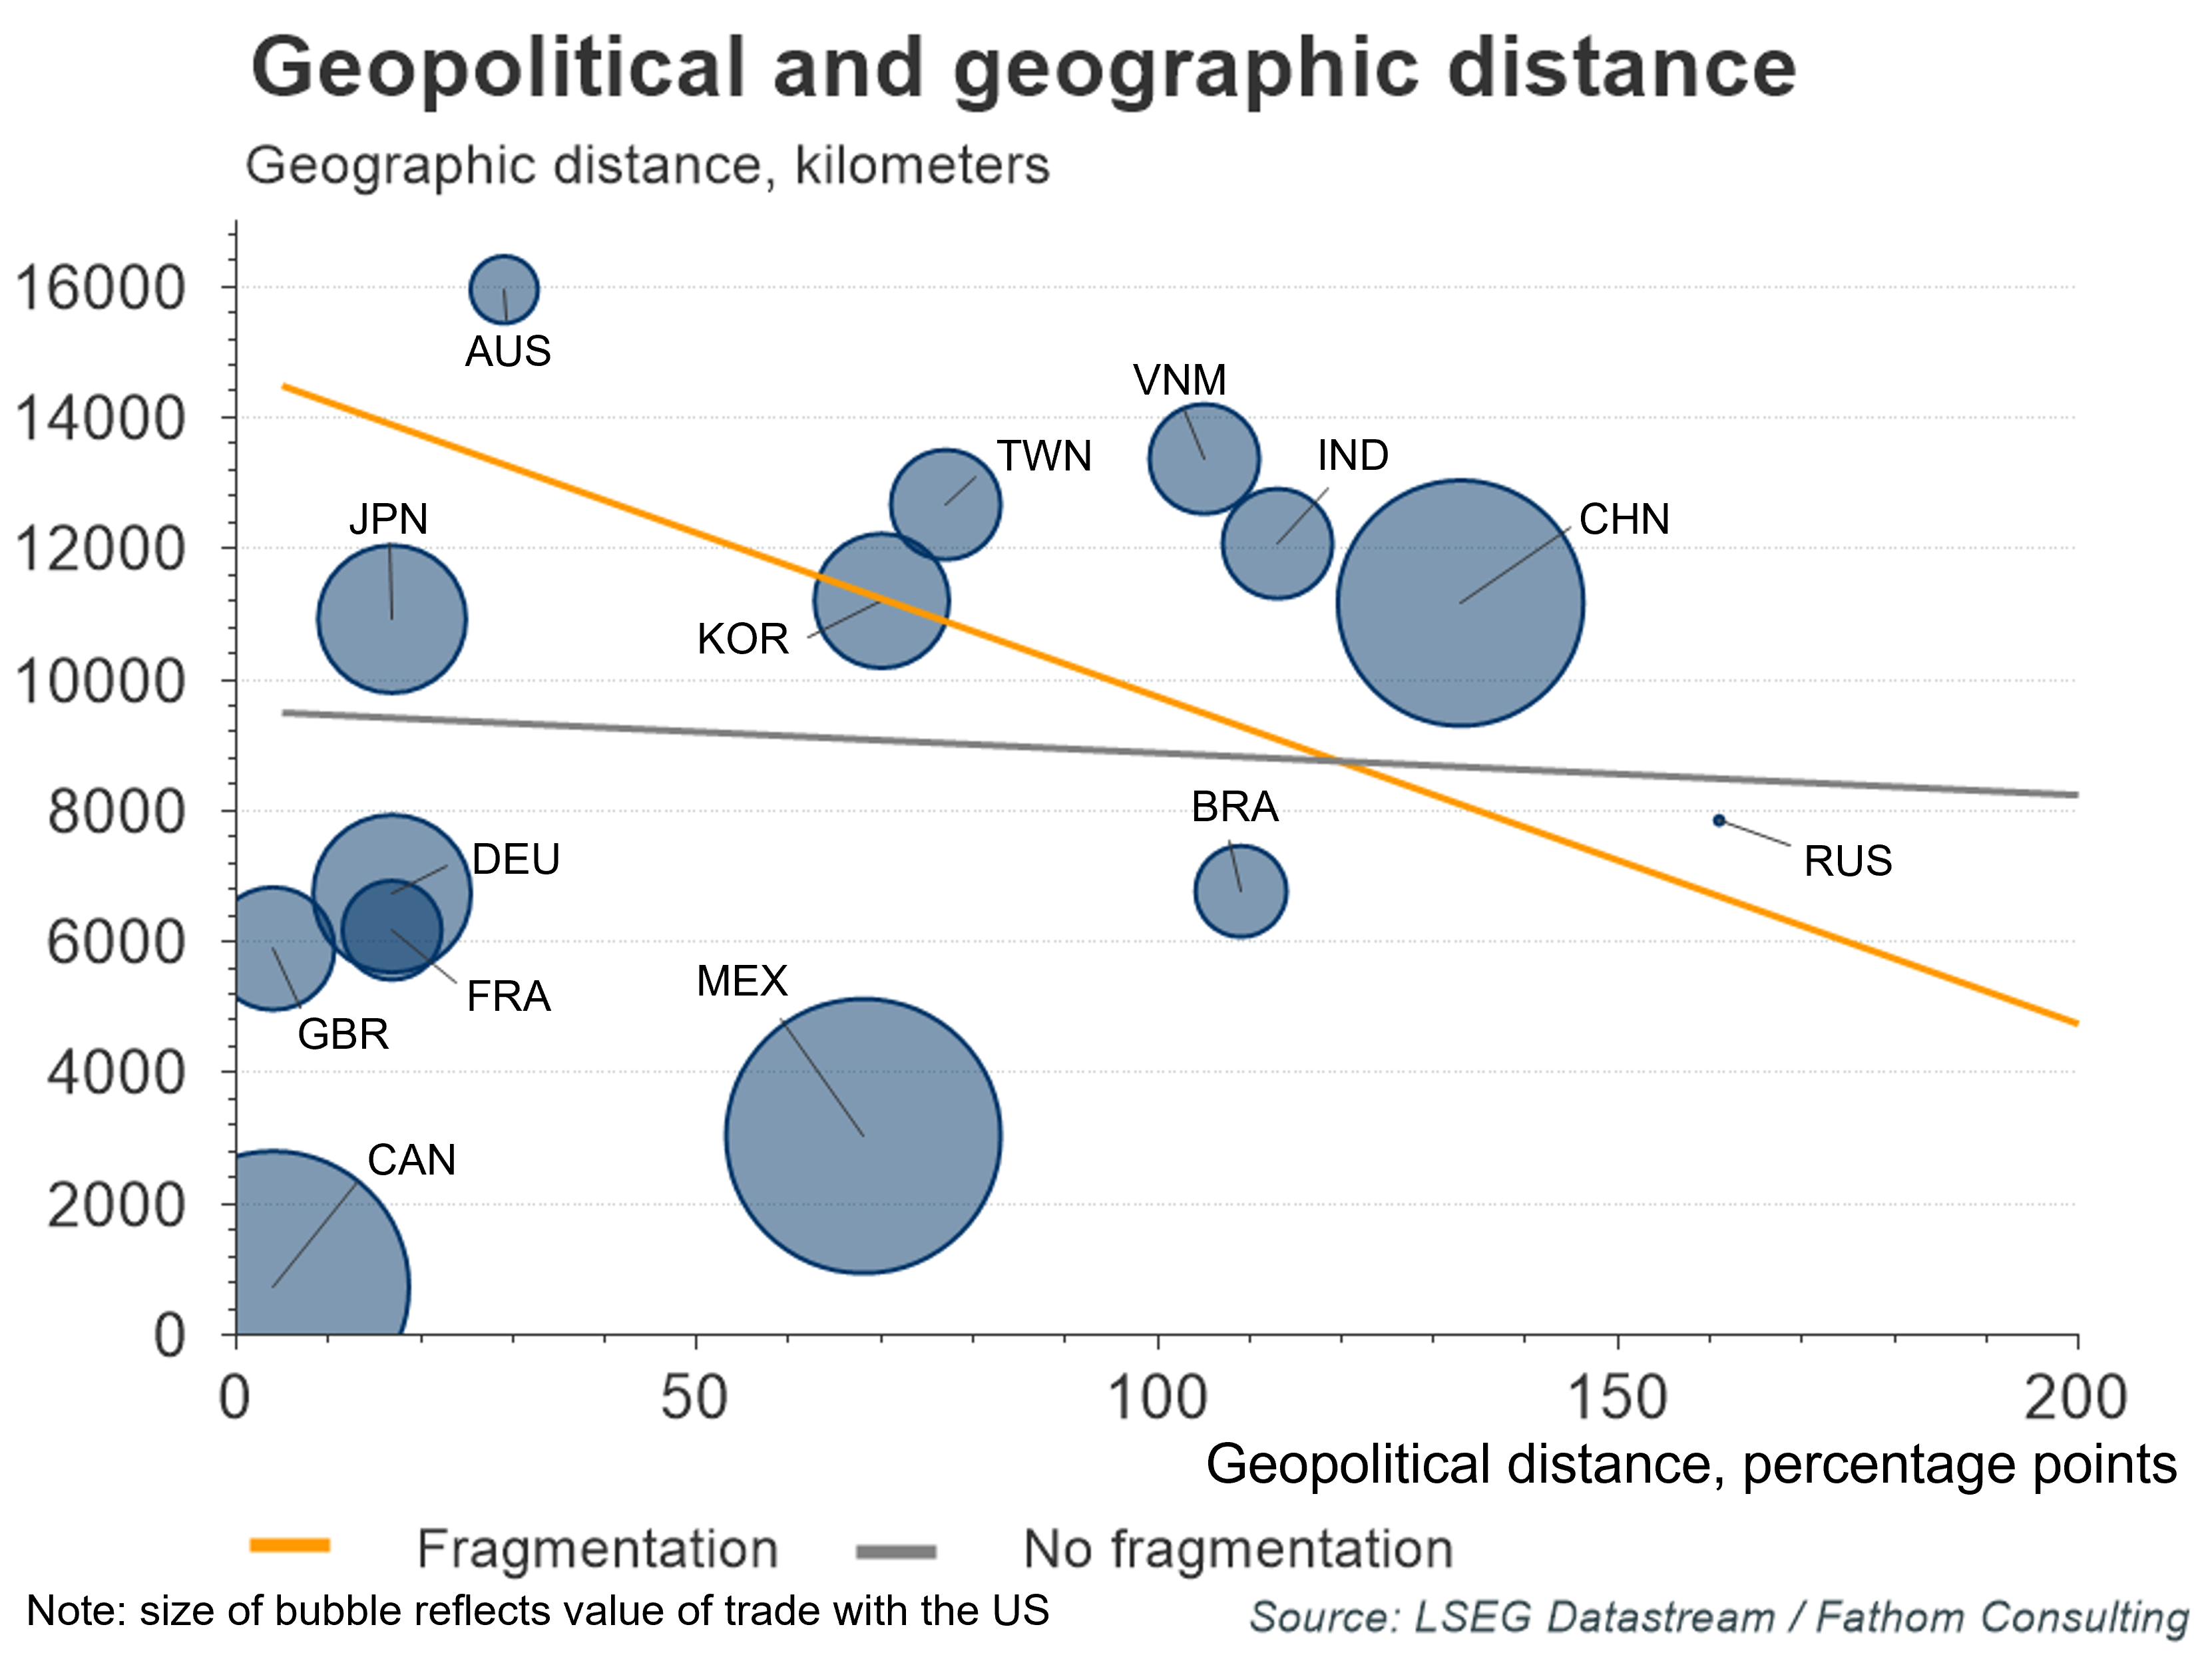
Refresh this chart in your browser | Edit the chart in Datastream
However, recent announcements have shown that the new US administration is also willing to erect trade barriers with countries that have historically had closer geopolitical relations with the US. Canada and Mexico were first in line for this treatment (although at the time of writing both have been granted temporary respite). The USA’s concern with both countries is that both sell more to the US than the US buys from them. Looking at the chart below, you can see how the US deficit with both has ballooned in recent decades, in part because both Canada and Mexico have substituted imports of US goods for products sourced from China.
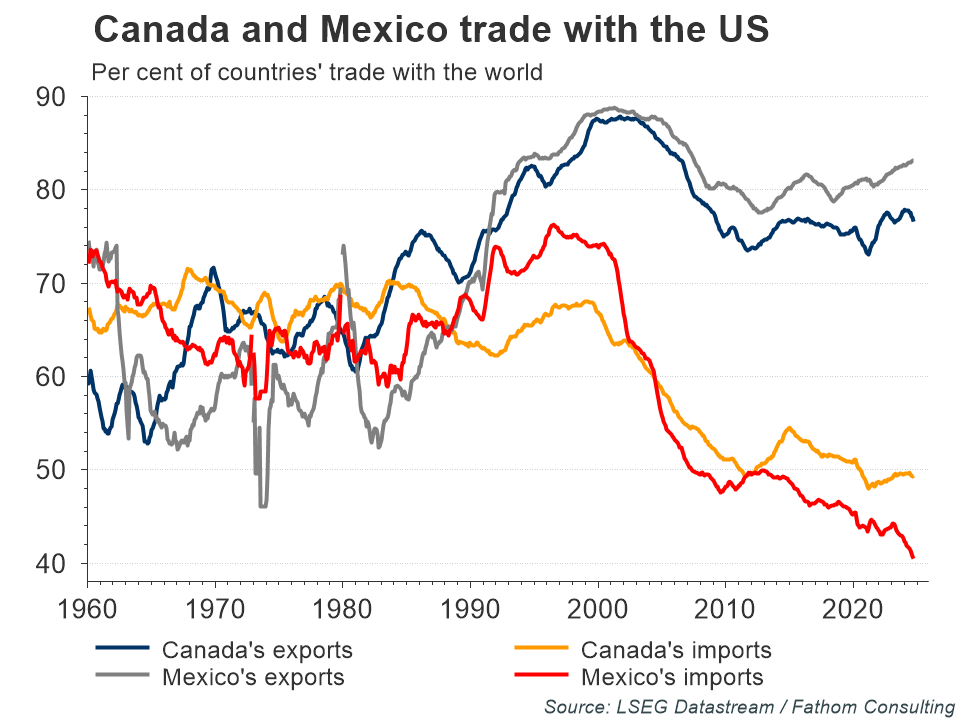
Refresh this chart in your browser | Edit the chart in Datastream
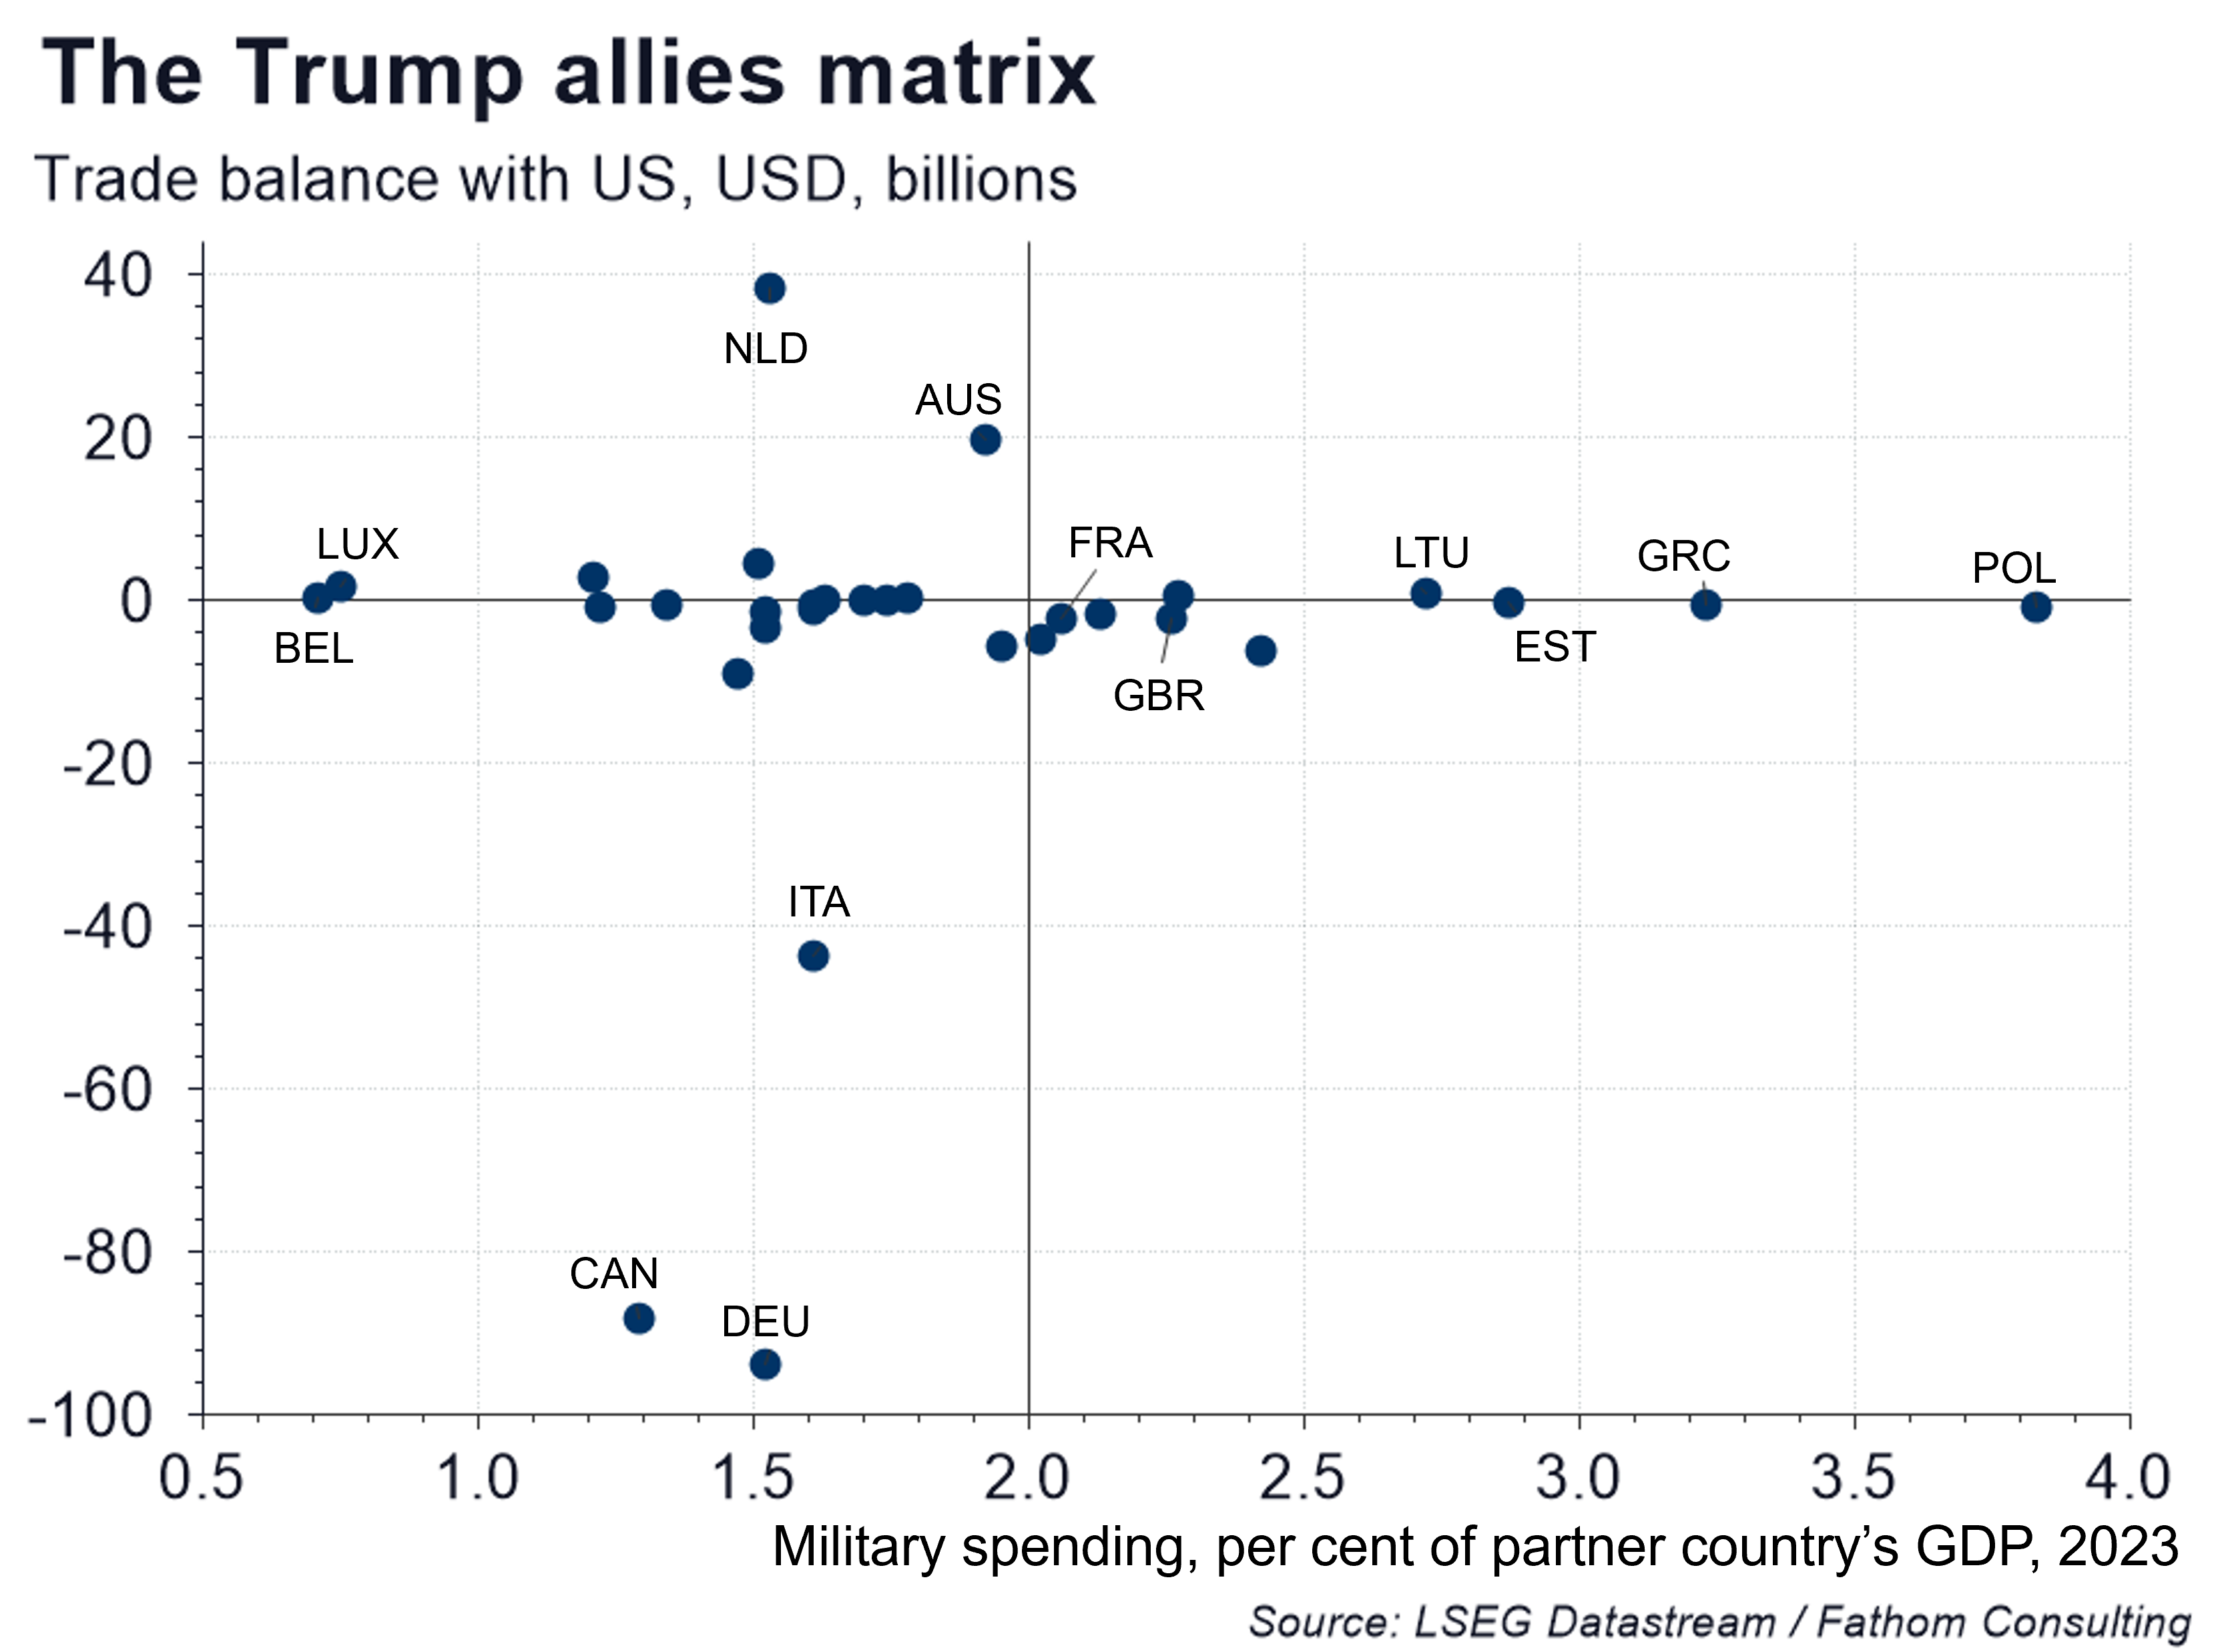
The Trump administration is hoping to use trade policy to extract concessions out of its partners around the world. In part, it wants to reduce the magnitude of the trade deficit. The extent to which it can do this without simultaneously reducing its own national competitiveness is unclear — normally, raising trade barriers would harm this, but the US is the world’s largest economy (and a relatively closed one) so if any country can achieve this, then it would be the US. But there is also a second goal in many cases — the US would like its allies to raise their military budgets too. Previously, the goal had been to reach NATO’s 2% target, but it now seems that the goal is higher (although the current-quoted 5% figure is most likely an opening gambit in negotiations).
The chart below shows how US military allies fare on two dimensions — military spending and their trade balance with the US. Countries that are in the bottom-left quadrant of the chart stand out as being particularly likely to receive increased scrutiny — they both have low military spending and sell more to the US than they buy from it. Alongside Canada, Germany stands out in this regard. With this in mind, it is notable that conversation seems to already be turning to the EU.
Refresh this chart in your browser | Edit the chart in Datastream
Want more charts and analysis? Access a pre-built library of charts built by Fathom Consulting via Datastream Chartbook in LSEG Workspace.
The UK presents itself as another interesting case. Thanks to its recent increase in military spending, it now spends more than 2% on defence (although that is someway short of the 5% number currently being bandied around). The UK also stands out as shipping roughly the same amount of goods to the US as it buys from it. Interestingly, on this point, the answer of whether the UK has a surplus or deficit with the US depends on which country’s data you look at — American data show that the US is the net exporter while British data suggest that the UK is the net exporter. Either way, the balance is close to zero.
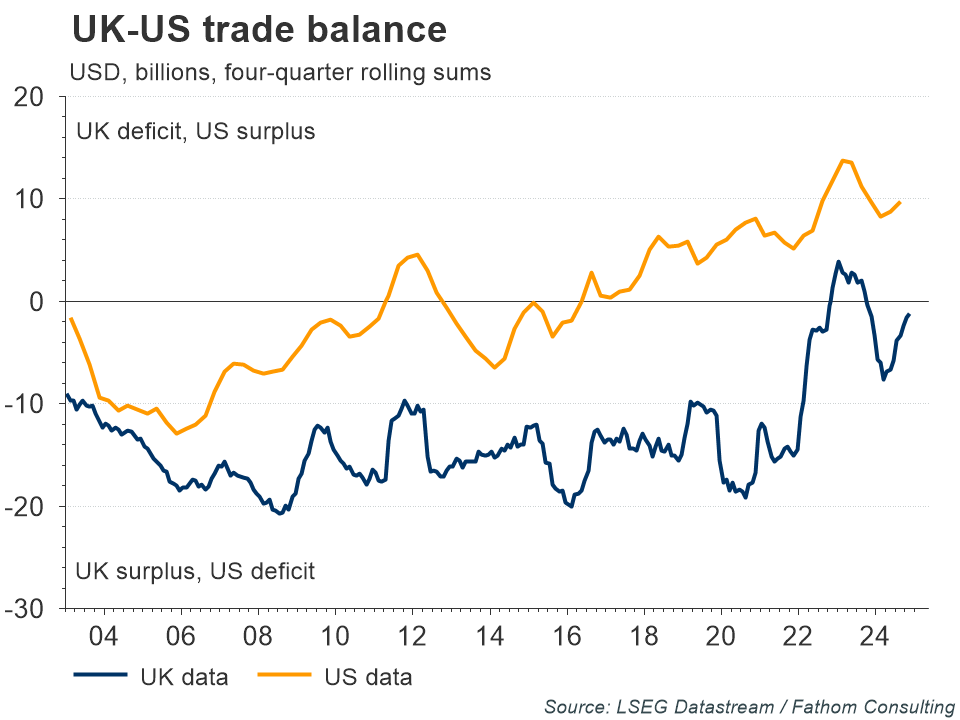
Refresh this chart in your browser | Edit the chart in Datastream
Overall, the assumption that previously prevailed (i.e., that a new period of heightened US-China tension would cause countries to friend-shore production) no longer seems an entirely safe one. It may still happen, but that depends upon the extent to which the current news on US trade policy can be viewed as part of the ‘art of the deal’ rather than the end result. A lot hangs on that assumption. The problem is that for dealmakers’ threats to be credible, you have to believe they are willing to follow through…
The views expressed in this article are the views of the author, not necessarily those of LSEG.
______________________________________________________________________________________
LSEG Datastream
Financial time series database which allows you to identify and examine trends, generate and test ideas and develop viewpoints on the market.
LSEG offers the world’s most comprehensive historical database for numerical macroeconomic and cross-asset financial data which started in the 1950s and has grown into an indispensable resource for financial professionals. Find out more.

