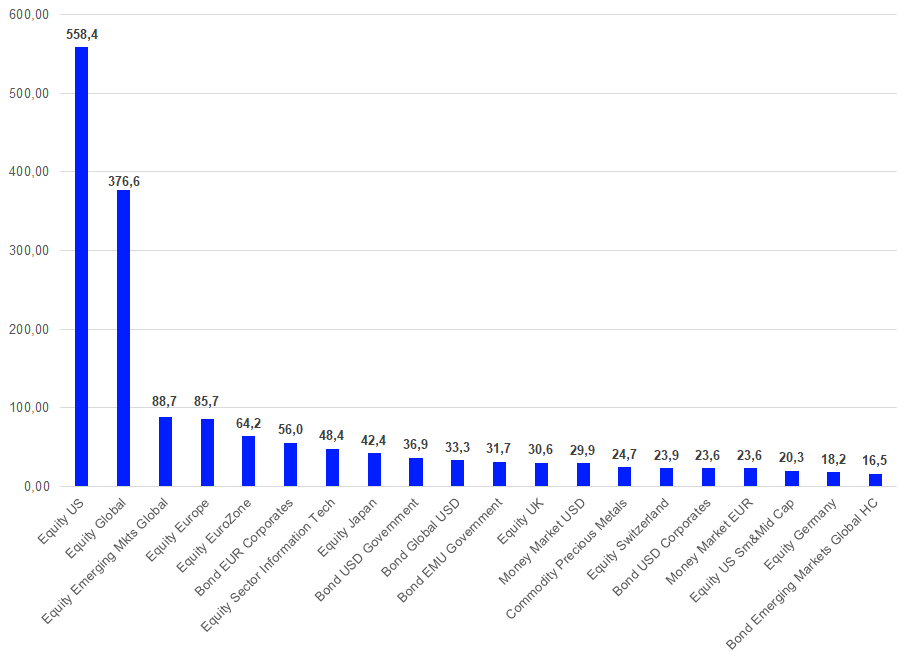
In order to examine the European ETF markets in further detail, a review of the Lipper global classifications will lead to more insights on the structure and concentration of assets within the European ETF industry. At the end of December 2024, the European ETF market was split into 168 different peer groups. The highest assets under management at the end of December were held by funds classified as Equity U.S. (€558.4 bn), followed by Equity Global (€376.6 bn), Equity Emerging Markets Global (€88.7 bn), Equity Europe (€85.7 bn), and Equity Eurozone (€64.2 bn). These five peer groups accounted for 56.38% of the overall assets under management in the European ETF segment, while the 10-top classifications by assets under management accounted for 66.81% and the 20-top classifications by assets under management accounted for 78.48% of the overall assets under management.
These numbers clearly show that the assets under management at the classification level are also highly concentrated. This assumption is backed by another impressive statistic.
Overall, only 17 of the 168 peer groups each accounted for more than 1% of assets under management. In total, these 17 peer groups accounted for €1,578.8 bn, or 75.84%, of the overall assets under management. In other words, around 10% of the Lipper classifications account for more than three quarters of the overall assets under management.
Graph 1: Twenty Largest Lipper Global Classifications by Assets Under Management, December 31, 2024 (Euro Billions)

Source: LSEG Lipper
In addition, it was noteworthy that the rankings of the largest classifications saw some movement in single positions over the last few years. As the positions of the classifications had been quite stable in the past, this indicates that European investors use ETFs to trade according to their market views. Even as some of these positions might be core holdings, once investors got into risk-off mode they also reduced their exposure to core asset classes.
That said, the ranking changes at the top of the league table which happened during the COVID-19 pandemic have not reversed since. Nevertheless, the current fund flow trends may indicate that Equity Europe and Equity Eurozone may claim back their old spots on the league table in the near future.
As a result of the high concentration of assets under management at the top of the table, the peer groups on the other side of the table showed some peer groups in the European ETF market are quite low in assets and their constituents may face the risk of being closed in the near future. This is because they are obviously lacking investor interest and might, therefore, not be profitable for their respective ETF promoters.
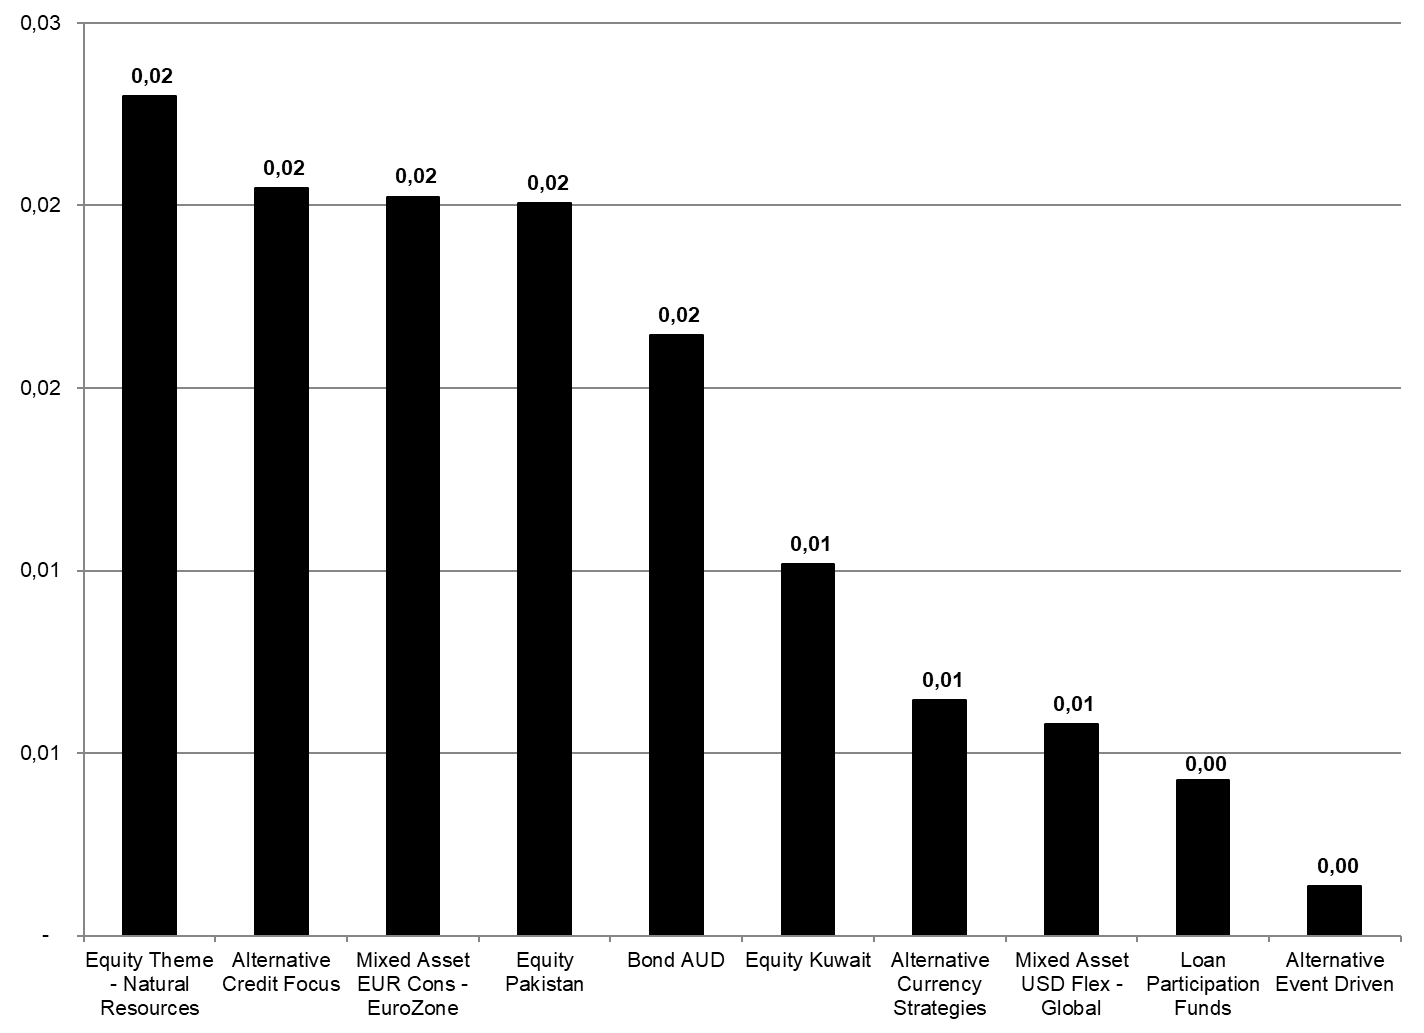
Graph 2: Ten Smallest Lipper Global Classifications by Assets Under Management, December 31, 2024 (Euro Millions)

Source: LSEG Lipper
With regard to the high concentration of the assets under management at the top of the table, it might not be surprising that the 10 smallest Lipper classifications account for only €128.3 m (€0.1 bn), or 0.0062%, of the overall market. These numbers underpin the assumption that some (if not the majority) of the ETFs which are classified within one of the 10 smallest Lipper classifications face a real closure risk, since their assets under management are too low to be profitable for the respective ETF promoters.
More generally, these numbers are showing that the European ETF industry is highly concentrated on all levels. While some of the concentration in the European ETF industry is kind of a self-fulfilling prophecy (a concentration of the assets under management at the promoter level is expected to generate a high concentration of the assets under management at the custodial level), the major driver for the concentration of the assets under management are the preferences of investors when it comes to the different asset types, classifications, replication methodologies, and of course the promoters themselves.
This article is for information purposes only and does not constitute any investment advice.
The views expressed are the views of the author, not necessarily those of LSEG.


