The Magnificent 7 (Mag-7) make up about one-third of the S&P 500’s total market value and have been the main contributors to earnings growth in recent quarters. For example, in 2023, S&P 500 earnings grew by 4.1%, but when we exclude the Mag-7, growth fell to -1.3%.
While the Mag-7 are still expected to post strong earnings growth in the quarters ahead, their relative contribution to overall S&P 500 earnings growth is expected to decline, with the rest of the index (S&P 493) playing a larger role heading into 2025.
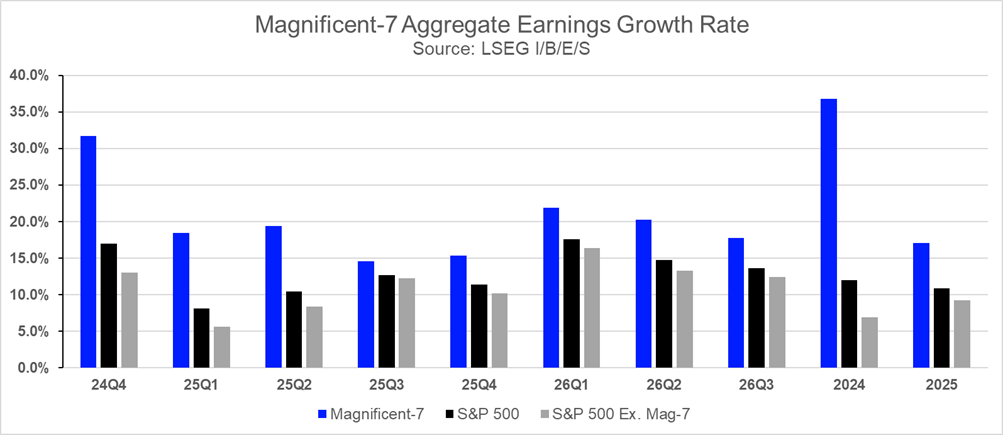
To illustrate this, Mag-7 earnings are expected to rise 17.1% in 2025, down from 36.8% in 2024, while S&P 500 ex. Mag-7 earnings are expected to rise 9.2% this year, an improvement from 6.9% last year. Another way to look at it is through the lens of earnings growth contribution – Mag-7 contributed 52% of total net earnings growth in 2024, which is expected to fall to 33% in 2025, according to analyst expectations from LSEG I/B/E/S.
In this note, we leverage LSEG Workspace to assess the Mag-7 outlook, showcasing insights from StarMine, I/B/E/S, Datastream, and Lipper.
A look at the Q4 numbers in detail
The Mag-7 delivered another strong earnings season in Q4 2024. Aggregate earnings for the group reached $131.2 billion (an all-time high), growing 31.7% year-over-year, far outpacing the S&P 500’s 16.9% growth (+13.0% y/y when excluding Mag-7). However, this 31.7% growth rate marks the lowest for the Mag-7 since Q1 2023 and is expected to decline further next quarter, with Q1 2025 growth forecasted at 18.5%.
It is worth pointing out that, due to the law of large numbers, it becomes increasingly difficult for the Mag-7 to sustain the high earnings growth rates seen in prior years. As a result, looking at the absolute level of earnings or quarter-over-quarter growth serves as a good secondary measure to assess earnings performance. Q4 quarter-over-quarter earnings growth was 19.3% and is expected to fall to -17.4% next quarter.
Nvidia led the way in earnings growth contribution, followed by Amazon and Meta. These three companies alone accounted for roughly 73% of the Mag-7’s total earnings growth in Q4, contributing 29% to the overall index’s growth. Nvidia has led the way from an earnings growth contribution perspective within the Mag-7 for six consecutive quarters, a trend expected to continue for the foreseeable future based on analyst expectations.
Exhibit 1: Magnificent-7 Aggregate Earnings Growth Rate
Top-line growth was also strong with Mag-7 aggregate revenue reaching $509.0 billion in Q4, growing by 12.8% – the lowest since Q2 2023 – but more than doubling the S&P 500’s 5.2% revenue growth. Once again, Nvidia and Amazon drove revenue growth, contributing 57% of the Mag-7’s revenue growth in Q4. Without the Mag-7, S&P 500 revenue growth drops to 4.2%.
Comparing earnings to revenue, the Mag-7 continues to main incredibly profitable, with Mag-7’s net profit margin rising to 25.8% in Q4, nearly double the S&P 500’s 13.4%. This marks an all-time high since data collection began in Q3 2020, underscoring the structural advantages these tech giants continue to maintain, as evidenced by the 2025 profit margin forecast of 25.3%, surpassing the 2024 margin of 24.0%.
Valuation and Earnings Surprises: A Shift in Sentiment?
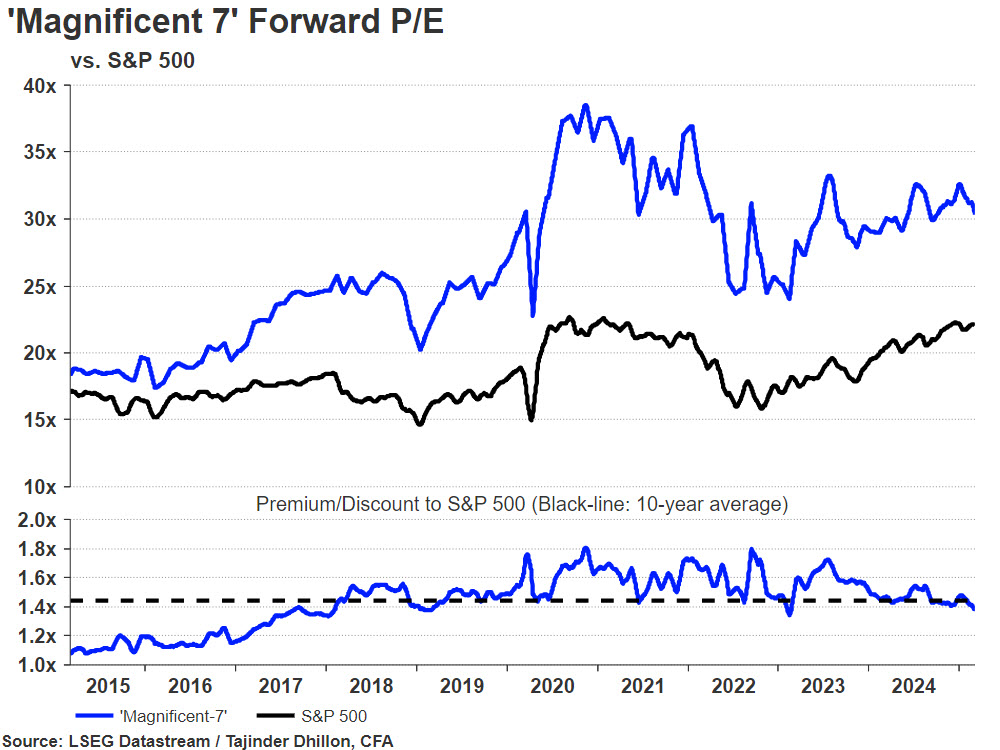
Given the strong earnings profile of the Mag-7, the group undoubtedly trades at a premium, though valuation levels have moderated slightly from recent highs. The forward price-to-earnings (P/E) ratio for the group stood at 28.3x as of February 28, compared to 21.8x for the S&P 500 (19.7x when excluding Mag-7). The Mag-7 P/E remains below its recent peak of 33.5x in Q1 2024, which itself was a decline from the record-high 37.5x seen in 2021.
Similarly, the forward price-to-sales (P/S) ratio for the Mag-7 was 7.2x, significantly higher than the S&P 500’s 2.7x. Excluding the Mag-7, the S&P 500’s forward P/S drops to 2.0x.
Exhibit 2: Magnificent-7 Forward Valuation
Earnings surprises, however, were somewhat muted compared to previous quarters. The Mag-7 posted an aggregate earnings surprise of 7.3%, slightly above the S&P 500’s 7.0%, but below their prior four-quarter average of 7.7%.
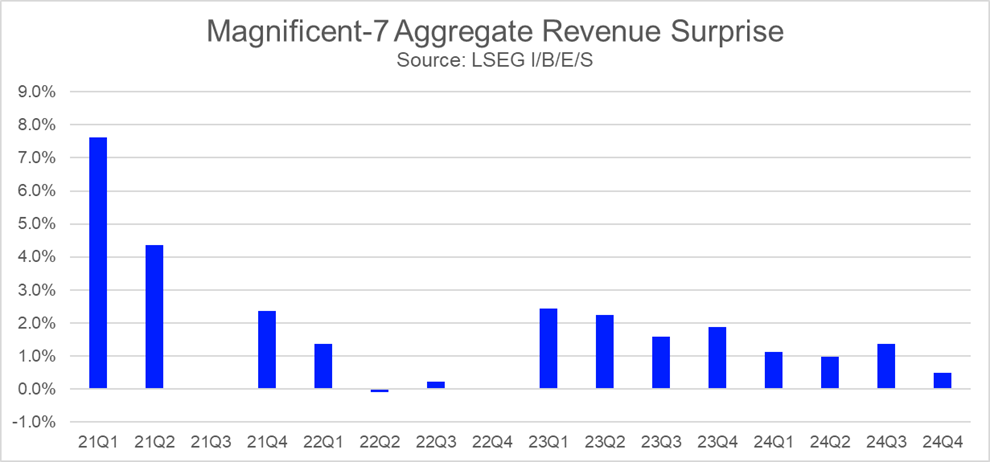
Most notable was on the revenue side, where the Mag-7 posted an aggregate revenue surprise rate of just 0.5% —the lowest since Q4 2022, and below the prior four-quarter average of 1.3%. This may suggest that analysts have largely caught up with the growth trajectory of the Mag-7, as the surprise rate has been gradually declining for the last six quarters, implying that expectations are now more accurately calibrated.
Exhibit 3: Magnificent-7 Aggregate Revenue Surprise Factor
How the Mag-7 rank across StarMine’s equity models
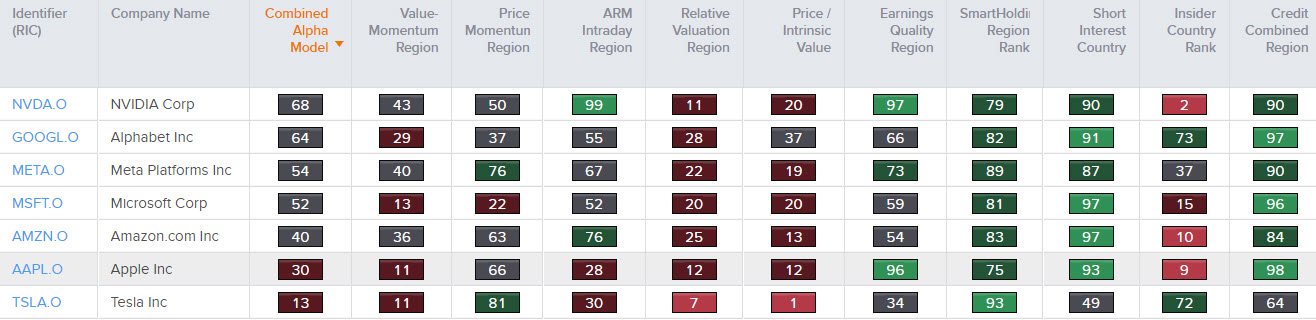
Given the meteoric price rise of many Mag-7 companies in recent years, it’s no surprise that these stocks are now considered expensive from a valuation perspective. This is evident in StarMine’s Relative Valuation and Intrinsic Value model scores, where all Mag-7 companies are flashing red—signaling that they are expensive compared to their peers on a percentile basis.
StarMine ranks companies from 1 to 100, where lower scores are bearish and higher scores are bullish. These rankings can be viewed at different levels, including regional, country, industry, and sub-industry comparisons.
Exhibit 4: Magnificent-7 StarMine Model Scores
Source: LSEG Workspace
Nvidia stands out with the highest analyst sentiment as measured by the Analyst Revision Model (ARM), with a model score of 99, followed by Amazon (76). Conversely, analysts are most pessimistic about Tesla, which holds an ARM score of just 30. Notably, Tesla’s ARM score has plummeted from 99 to 30 over the past 90 days, reflecting a string of downgrades from input components including Revenue, EBITDA, and EPS over three time periods (current quarter, current year, next year).
We previously highlighted the strong earnings profile of the Mag-7, and this is further reinforced by StarMine’s Earnings Quality (EQ) model, which evaluates the sustainability of future earnings. Aside from Tesla, which lags in this category, most companies in the group hold neutral to bullish EQ scores, led by Nvidia (97) and Apple (96).
Key profitability factors such as Return on Equity (ROE), Return on Assets (ROA), changes in accruals, and profit margins—all components of the EQ model—are also integral to StarMine’s Smart Holdings (SH) model. This model assesses how well-aligned a company is with the stock selection preferences of institutional investors based on 25 factors including Growth, Value, Price Momentum, Leverage, Analyst Revisions, and Profitability. Notably, every company in the Mag-7 holds an SH score in the top quartile.
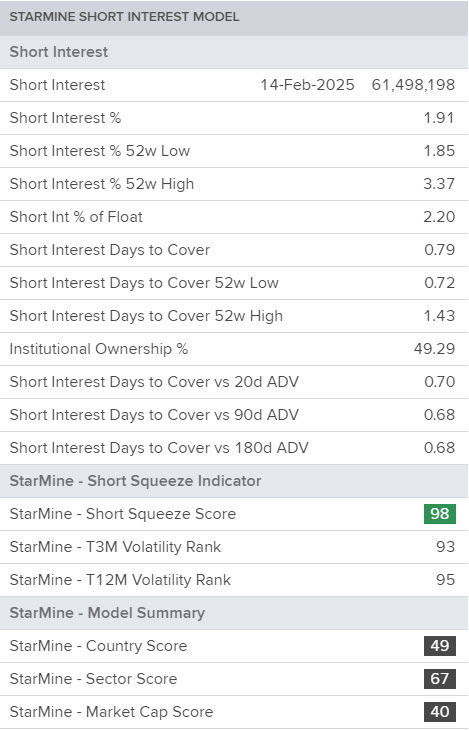
Tesla has the highest short interest in the group at 1.91% of outstanding shares, down from 3.3% in June 2024, along with the lowest institutional ownership (49.3%), resulting in a Short Interest model score of 49—the lowest in the group. The model incorporates institutional ownership because a lower percentage suggests fewer available shares to borrow for shorting. This implies that investors are making a concerted effort to short Tesla despite the limited supply of shares.
Exhibit 5: Short Interest Model – Tesla Inc
Source: LSEG Workspace
Because mega-cap tech stocks like Apple, NVIDIA, and Microsoft have high market expectations, our Intrinsic Value (IV) analysis reflects a similar outlook. Using the Aggregates app in LSEG Workspace, we can aggregate individual company data to a sector level and overlay various StarMine quantitative analytics, providing an insightful top-down view.
The StarMine Intrinsic Value 5-Year Market-Implied Growth Rate for the Information Technology sector currently stands at 16.7%, significantly higher than the Intrinsic Value Forward 5-Year SmartEstimate Growth Rate of 10.7%.
This gap suggests that market expectations for future growth are more optimistic than analyst-adjusted forecasts, which incorporate SmartEstimates to account for analyst bias and emphasize the most timely and accurate inputs. Since the SmartEstimate-based forecast serves as a more robust indicator of realistic earnings potential, the disparity highlights whether the sector is being priced too aggressively by investors.
We see a similar picture in Consumer Discretionary, where expectations are heavily influenced by Amazon. Meanwhile, Meta and Alphabet, which fall under Communication Services, appear to be more in line with analyst-adjusted forecasts, as their market-implied and SmartEstimate growth rates are closely aligned.
Exhibit 6: S&P 500 Aggregate StarMine Model Scores
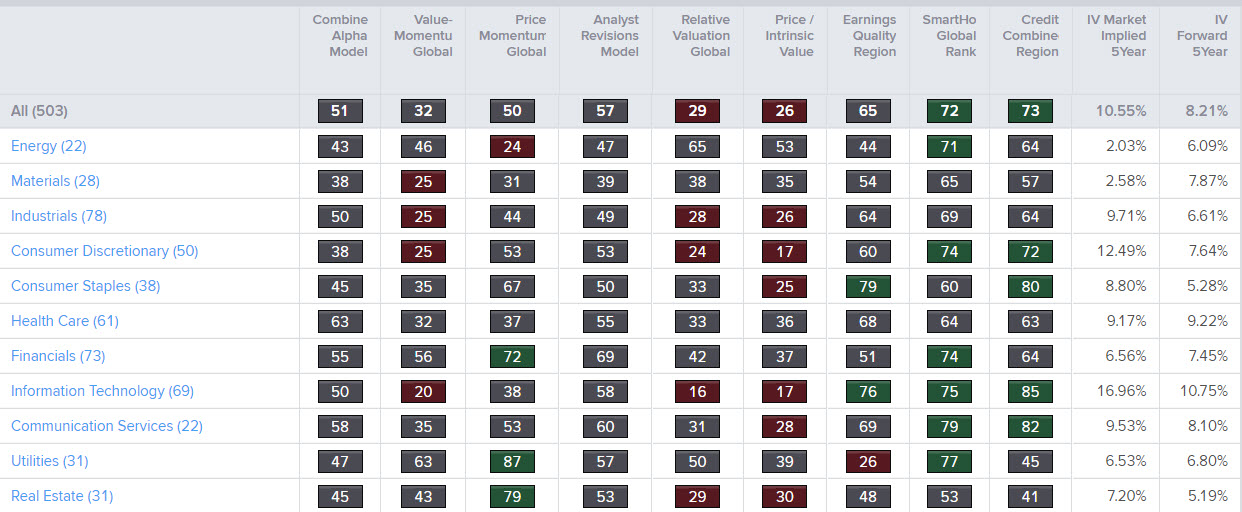
Source: LSEG Workspace
A look at Lipper Fund Flows – Cap vs. Equal Weight
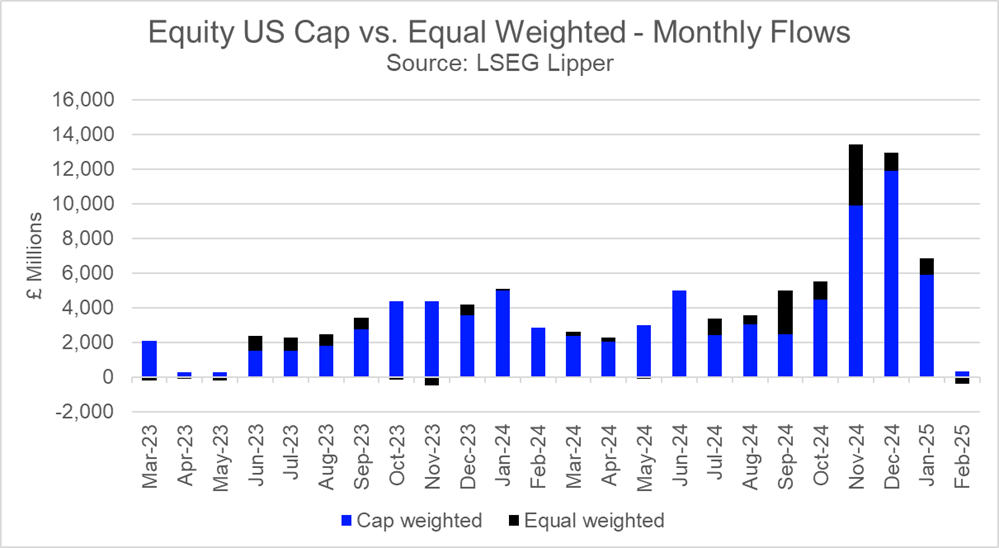
At the beginning of this note, we highlighted the shifting earnings growth contribution from the Mag-7 to the broader S&P 493. In a similar vein, we turn to Lipper fund flows, analyzing the relationship between U.S. market-cap-weighted ETFs and equal-weighted ETFs listed on the London Stock Exchange.
2024 saw total inflows into U.S. ETFs of £64.4 billion, of which 84.4% was allocated to cap-weighted ETFs and 15.6% to equal-weighted ETFs. There was a notable increase in flows into equal-weighted ETFs starting in Q4 2024.
November saw a surge of inflows post US election results, with net flows of £13.4 billion—or 244% of the last high, which was hit in October. Some £3.49bn of this was in equal weighted ETFs (26% of total flows in November) and equivalent to the total net flows for August.
Net flows remained strong in December, totaling £12.9 billion, of which cap-weighted funds captured the lion’s share of inflows at £11.9 billion. However, 2025 has seen a sharp decline in momentum into U.S. ETFs as the market digests concerns around trade policy and economic uncertainty amid an elevated U.S. market, with the forward P/E ratio sitting in the top decile dating back to 1985.
The month of February was particularly telling, with net outflows of £68 million, marking the first net outflow in at least the last 23 months, coinciding with the timetable for tariff implementation in March and April. The Mag-7 as a group has seen prices fall by 7.7% year-to-date compared to a 0.7% decline for the S&P 500.
Exhibit 7: Lipper Fund Flows – Cap Weight vs. Equal Weight
Conclusion
Q4 delivered another strong quarter for both top- and bottom-line growth, and it appears that analysts have become more precise in forecasting revenue for the group. The Mag-7 remains highly profitable but continues to trade at a substantial premium to the S&P 500, though valuations have moderated in recent quarters. Looking ahead, we expect the S&P 493 to play a larger role in earnings growth contribution on a relative basis.
Fund flows showed a surge in equal-weighted ETFs in Q4 2024, and we will continue to monitor this data throughout the year as a key measure of investor sentiment and potential market rotation.
— Additional Lipper data provided by Dewi John.
LSEG Workspace is a complete solution for research and analytics. It places the most comprehensive market information, news, analytics, and trading tools available into a desktop.
LSEG I/B/E/S Estimates are a market leader, boasting 200+ metrics and indicators across 15 industries. Find more information on our estimates data.
Get unique value-add analytics and predictive financial modeling, dedicated to making investment research smarter with LSEG StarMine data.
LSEG Lipper delivers data on more than 330,000 collective investments in 113 countries. Find out more


