
Asset class view
- Money market funds (MMFs) saw the largest inflows, with £6.7bn
- Bond inflows were less than half of Decembers, at £1.61bn—the lowest since last September’s redemptions.
Active v passive
- Mutual funds and ETFs took £6.4bn over January, with redemptions of £303m excluding MMF.
- Active equity strategies suffered the largest redemptions, shedding £3.13bn.
Classifications
- Outside of cash, investors favoured US and global equities, alongside USD and GBP investment grade bond funds.
- UK equity funds suffered redemptions of about £1.7bn over the month.
Sustainable fund flows
- Sustainable flows were positive for MMFs (£33m) and bonds (£133m).
- Sustainable equity funds suffered outflows (£304m), in line with the broader market.
Asset manager view
- HSBC was January’s top money taker, attracting £2.12bn, with flows driven by MMFs.
Flows by Asset Class
Three-year flows
Chart 1: Asset Class Flows, 36 Months, to January 2025 (£bn)
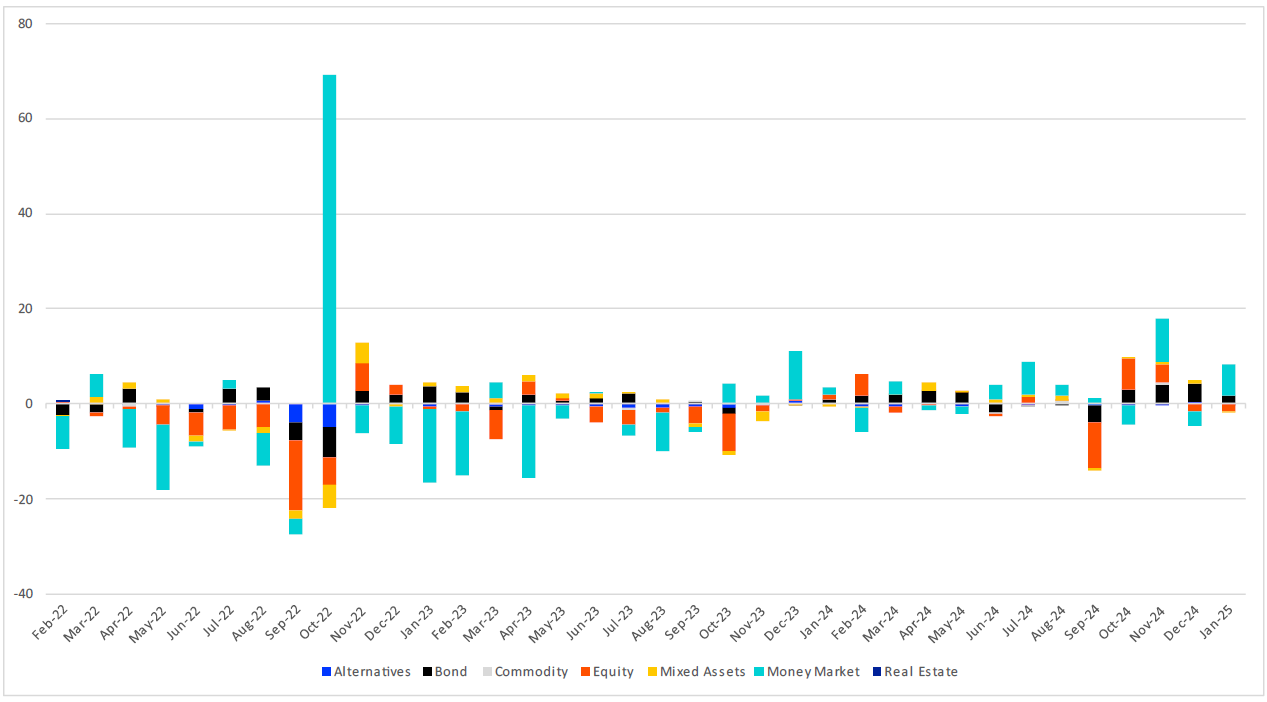
Source: LSEG Lipper
Despite the broadly positive environment for equities, as non-US markets played catch-up, equity funds overall saw outflows broadly in line with December (£14.4bn versus £14,7bn respectively) despite the sharp drawdown at the end of 2024.
While December saw a significant bond sell-off, spearheaded by Treasuries with longer-dated maturities, flows overall were strong for the month, at £3.82bn. In January, a month where modest yield moves drove muted fixed income gains, inflows were less than half of this, at £1.61bn—the lowest since last September’s redemptions of £3.48bn, which were themselves the end-point of a negative four-month run for the asset class.
Mixed asset funds experienced their first negative month since the end of Q3 2024, shedding £188m, while it was another negative month for both alternatives (-£67m), real estate (£188m) and commodities (-£12m): the later despite the asset class being broadly up over the month.
Active versus Passive
Chart 2: Asset Class Flows, Active and Passive, January 2025 (£bn)
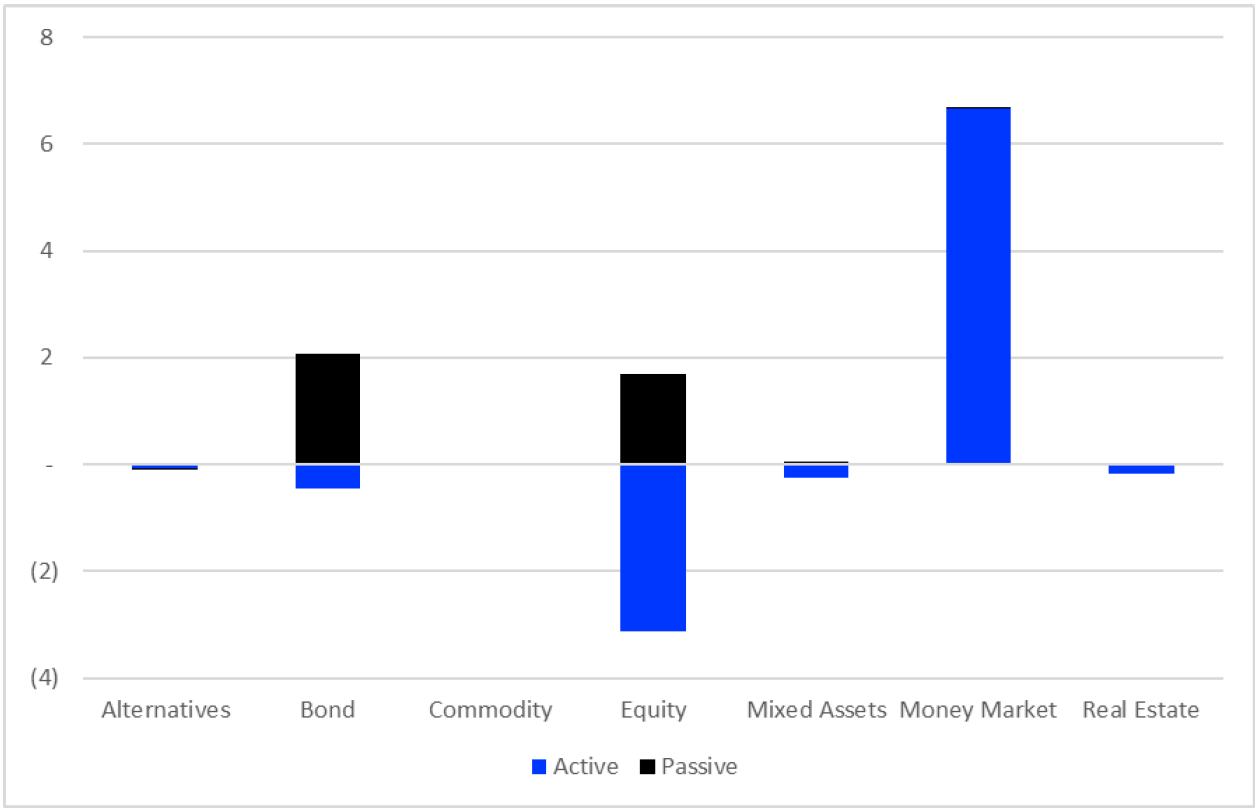
Source: LSEG Lipper
Overall, mutual funds and ETFs took £6.4bn over January, with redemptions of £303m excluding MMFs. Active strategies took £2.56bn (-£4.11bn ex-MMFs), while passives netted £3.84bn (£3.81bn ex MMFs).
The S&P500 rebounded strongly on January 10, and global indices along with it. The US blue chip index gave it its best shot for the best part of a fortnight, after which it took a breather into February. But the heavy lifting of delivering a decent first month for equity investors had been done. Not enough to convince said investors, though, with another month of redemptions: this time with outflows of £3.13bn from actively managed equity funds, and £1.69bn into their passive counterparts.
It was a broadly similar story of active misery, passive joy with bonds, as the former shed £456m and the later netted £2.06bn. As we have previously noted, investors may well have heard active managers’ warnings about throwing cash at the most indebted entities on bond indices, but they’re doing it nonetheless.
Historically, passive mixed assets have been quite somnolent, but in January attracted £61m as their active peers shed £263m,
ETFs and Passive Mutual Funds
Chart 3: Passive Asset Class Flows, Mutual Funds v ETFs, January 2025 (£bn)
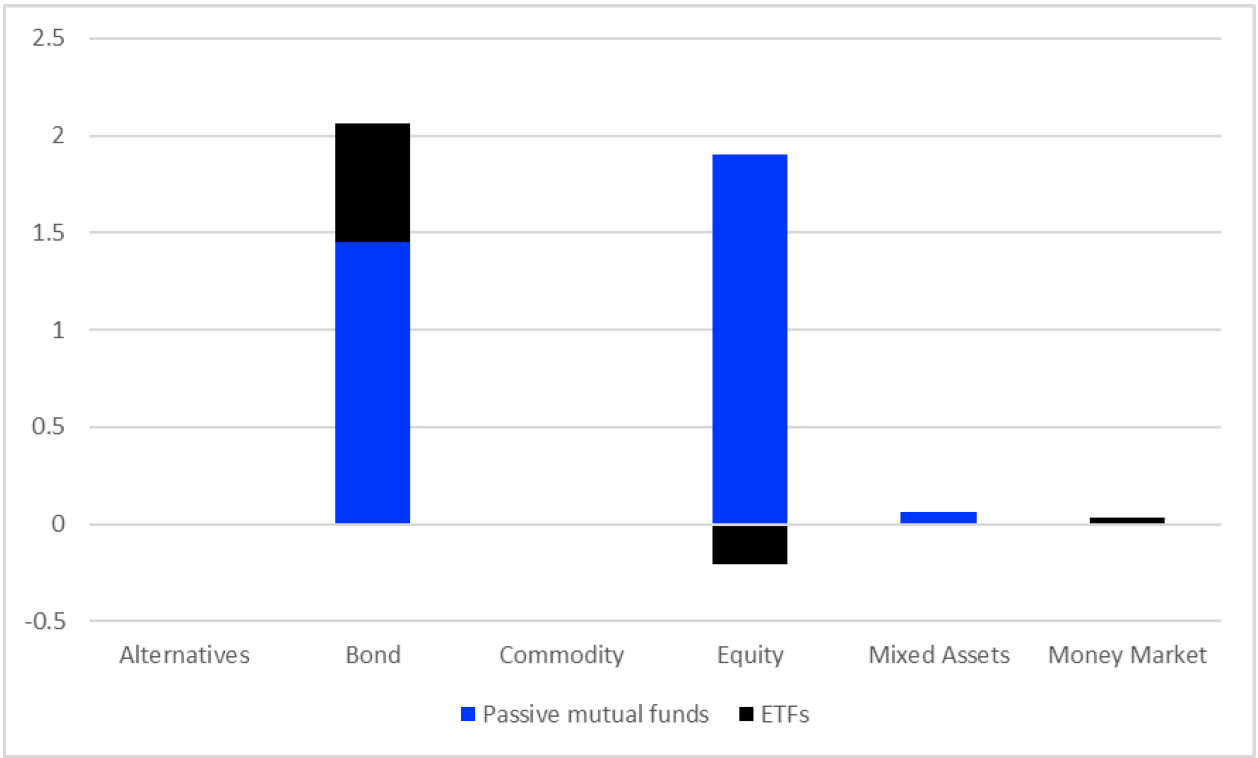
Source: LSEG Lipper
Passive funds took a total of £3.84bn over January, up from December’s £3.18bn, despite lower flows to long-term funds overall. This was split £3.41bn to mutual funds and £427m to ETFs. Flows to bonds went £1.45bn to mutual funds and £612m to ETFs, while their equity equivalents went £1.9bn to mutual funds, with outflows of £208m to ETFs.
The entire (albeit limited) take of mixed asset passives, plus a little more, went to mutual funds.
Flows by Classification
Largest inflows
Chart 4: Largest Positive Flows by LSEG Lipper Global Classification, January 2025 (£bn)
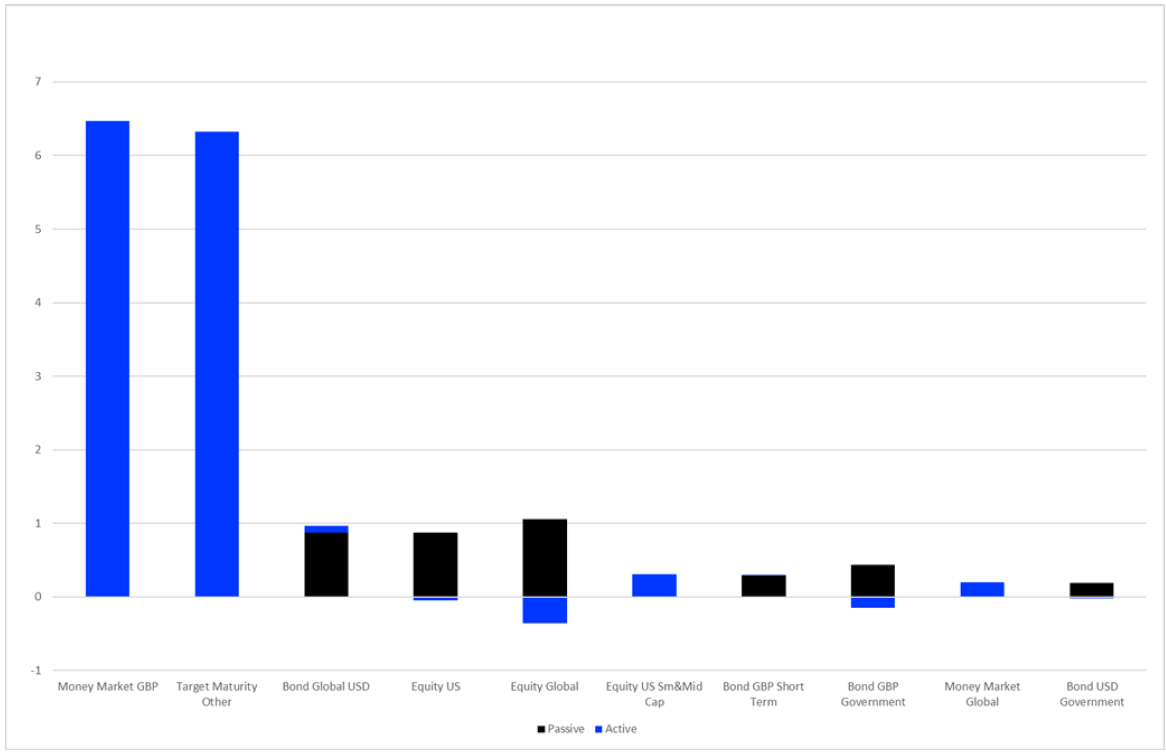
Source: LSEG Lipper
Given the trend at the broad asset class level, it’s pretty much a given that Money Market GBP should lead the pack at the classification level, attracting £6.46bn, all active, and across a range of promoters (see table below).
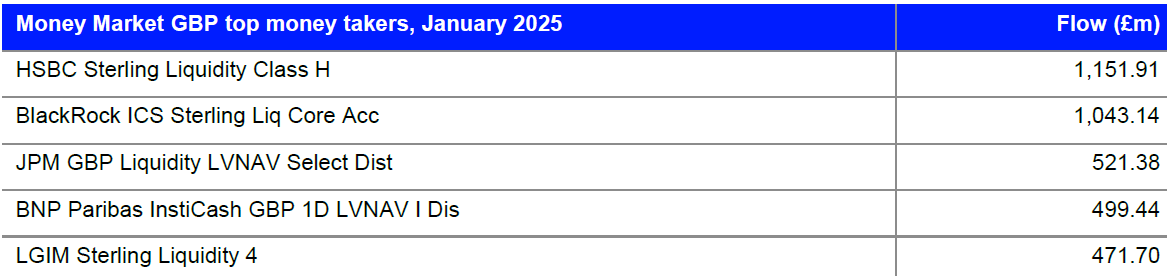
Source: LSEG Lipper
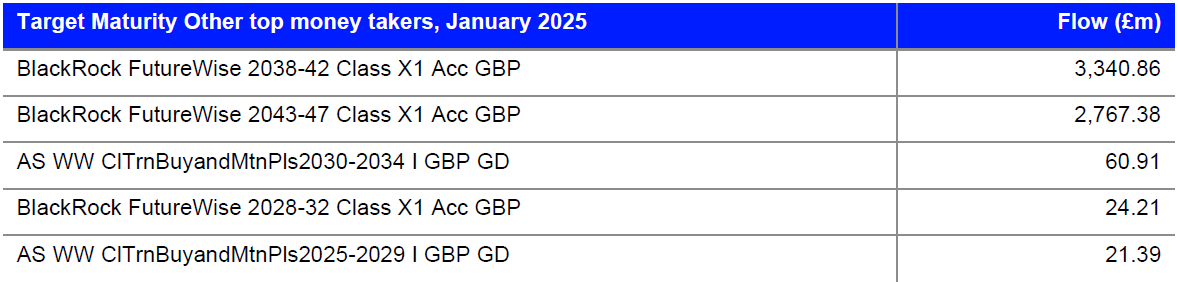
What’s more of a surprise is second-placed Target Maturity Other (£6.32bn). It’s most unusual to see this classification heading the table. However, this is counterbalanced by more than £6bn redeemed from another Blackrock share class, from its FutureWise range, which Lipper classifies as Mixed Asset GBP Aggressive. As a result, the latter sees the largest outflows for the month—which is itself unusual in what is the most popular mixed asset classification (chart 5). On balance, this looks to be in the main a shifting of BlackRock clients from a number of its FutureWise funds into one single one.
Source: LSEG Lipper
With that out of the way, let’s se what else has been going on. Over January, the US Federal Reserve paused rate cuts, and the dollar moderated. Investors seem to have taken this as an opportunity to top up their dollar-denominated IG exposure, with allocations to Bond Global USD (£962m) and Bond USD Government (£174m), both predominantly to passive vehicles. Sterling fixed income funds also fared well, with allocations to Bond GBP Short Term (£296m) and Bond GBP Government (£288m). It’s worth noting—again—that despite the strong relative performance of high yield, this month and longer term, there’s little investor interest, with the vast majority of FI cash going into investment grade.
It’s also been a good month for Equity US (£826m), Equity Global (£694m) and Equity US Small & Mid Cap (£312m), despite the outflows for equities as a whole. The first two are dominated by passive flows. Given the nature of the market, that shouldn’t be a surprise, but over recent months, the net money has been flowing to active strategies, The biggest money-takers have been active funds, but so have been the biggest money-losers, so on balance it’s ben an unusually relatively good month for passive Equity US.
Largest Outflows
Chart 5: Largest Outflows by LSEG Lipper Global Classification, January 2025 (£bn)
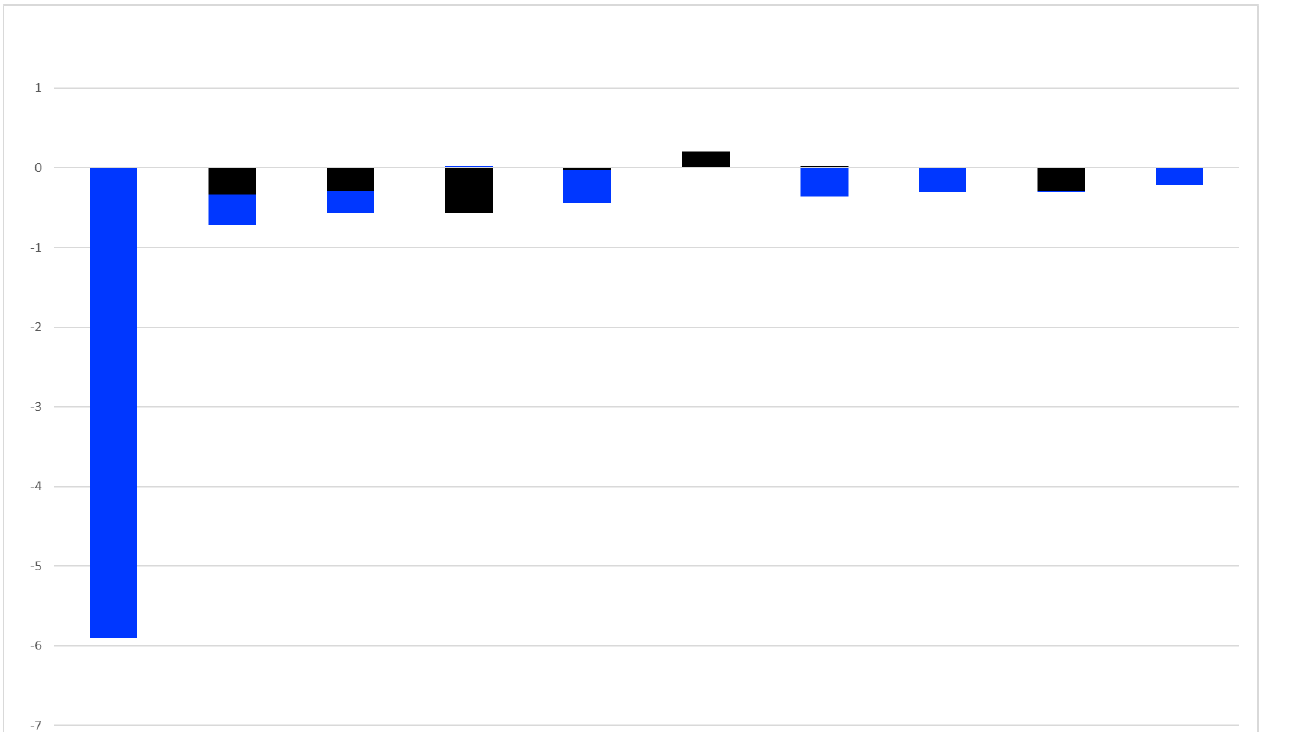
Source: LSEG Lipper
We can pass over the largest redemptions by classification, having determined its likely causes above.
January saw UK equities outperform, but you wouldn’t know it from the chart above. Equity UK Small & Mid Cap (-£720m), Equity UK (-£571m) and Equity UK Income (-£445m) all suffered significant loses. Eurozone and APAC equity markets outperformed, but again the relevant classifications sold off: Equity Europe ex UK (-£389m) and Equity Asia Pacific ex Japan
(-£339m).
Just outside the table, Equity India saw outflows of £176m. While not huge, it may be an indicator that, with the market off its September peak, investors are getting a little edgy over valuations in an market that have served them very well recently.
Sustainable Fund Flows
Chart 6: Sustainable Asset Class Flows, January 2025 (£bn)
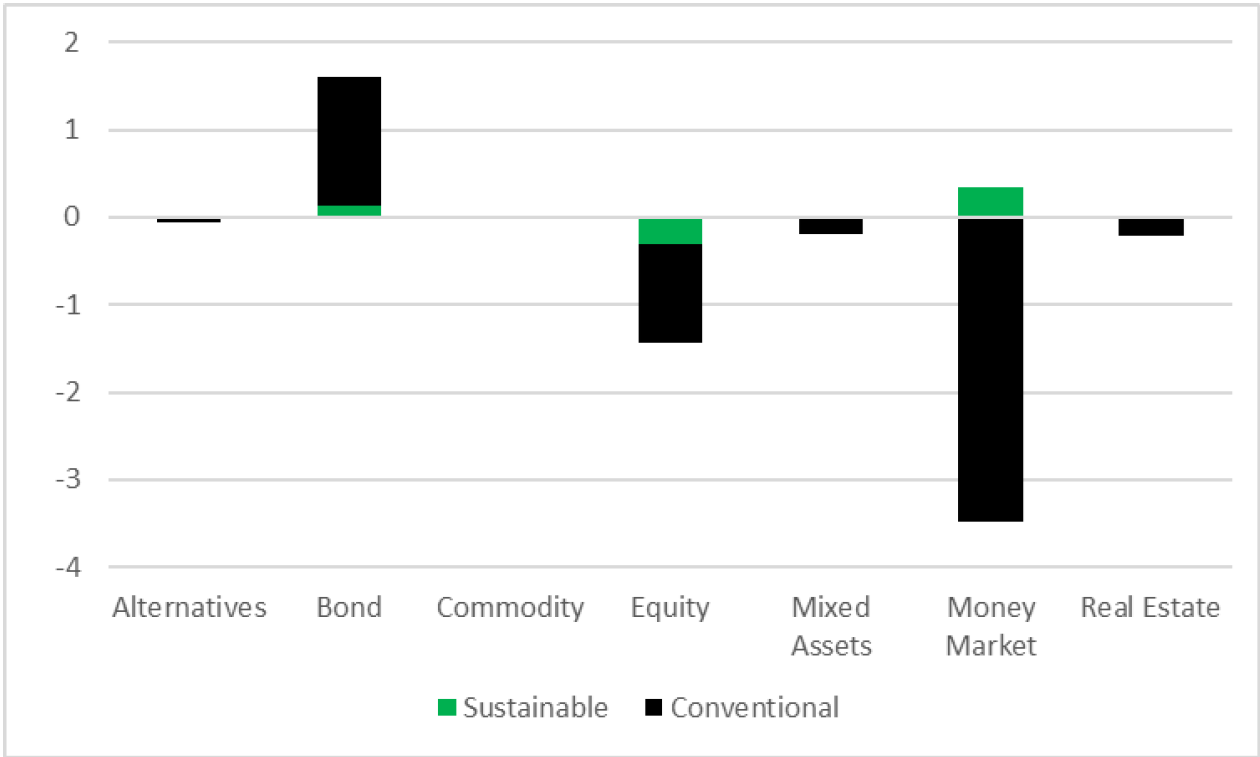
Source: LSEG Lipper
Sustainable funds saw net flows of £153m in January, although this fell to -£181m when MMFs were excluded.
At the level of particular asset classes, flows are on trend with December’s figures: positive for MMFs (£33m, albeit the previous month total MMF flows were negative) and bonds (£133m), with outflows for sustainable equity (£304m), in line with the broader market.
Apologies (to everyone but HSBC, who must be rather pleased) for the rather monotonous chart below, but the top sustainable asset class for January is a function of MMF flows in general, with HSBC
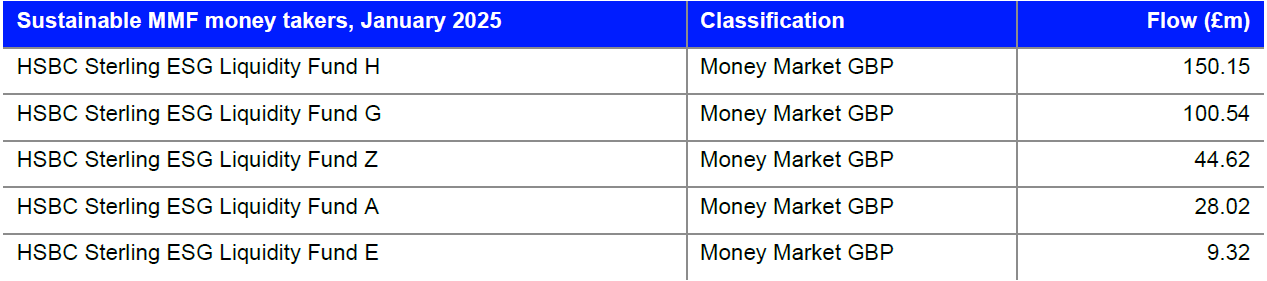
Source: LSEG Lipper
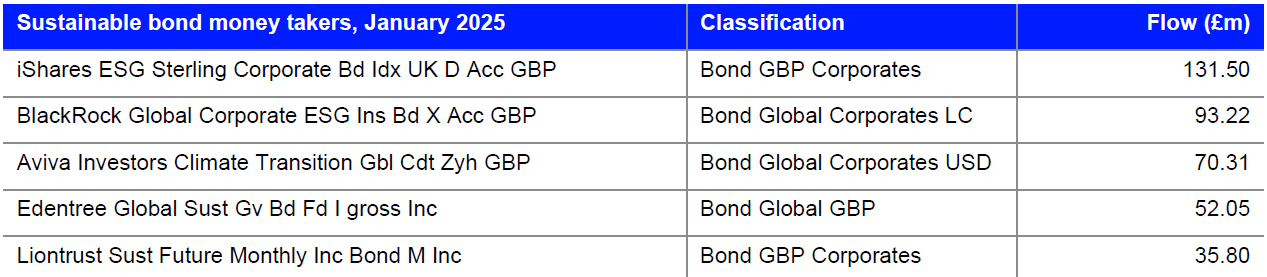
Bond flows were relatively muted, in line with the broader market, but with a tendency towards GBP and global investment grade corporate credit, as can be seen from the table below.
Source: LSEG Lipper
The Sustainable Fund Flows section has a narrower and stricter focus than those which indicate some form of ESG strategy in their fund documentation—to a smaller group of sustainable funds, defined as all SFDR article 9 funds plus all Lipper Responsible Investment Attribute funds reduced to those containing indicative sustainable keywords in the fund name.
Flows by Promoter
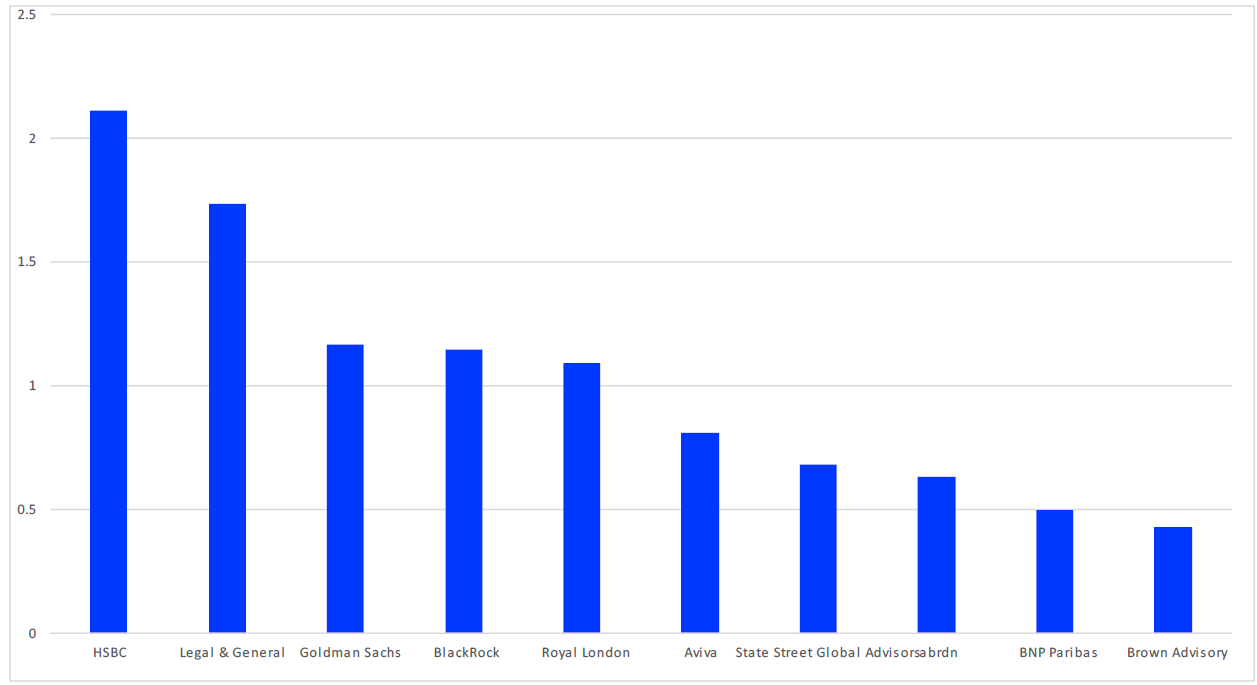
Chart 7: Largest Positive Flows by Promoter, January 2025 (£bn)
Source: LSEG Lipper
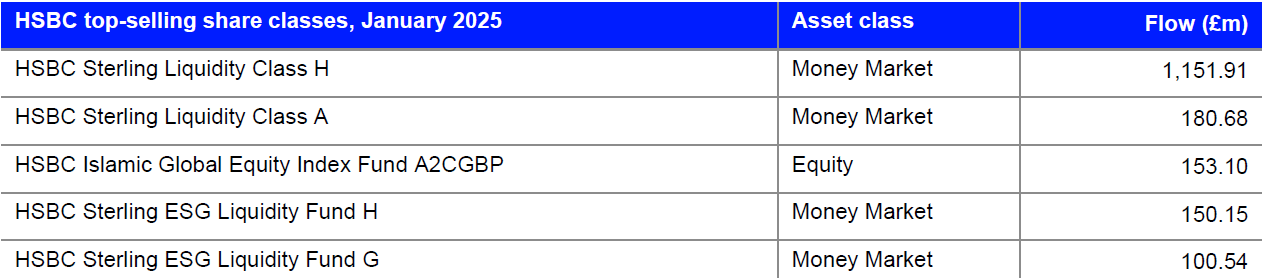
HSBC was January’s top money taker, netting £2.12bn, driven largely by flows into its MMFs, (£1.6bn), and positive if smaller flows to bond, equity and mixed asset funds.
Source: LSEG Lipper
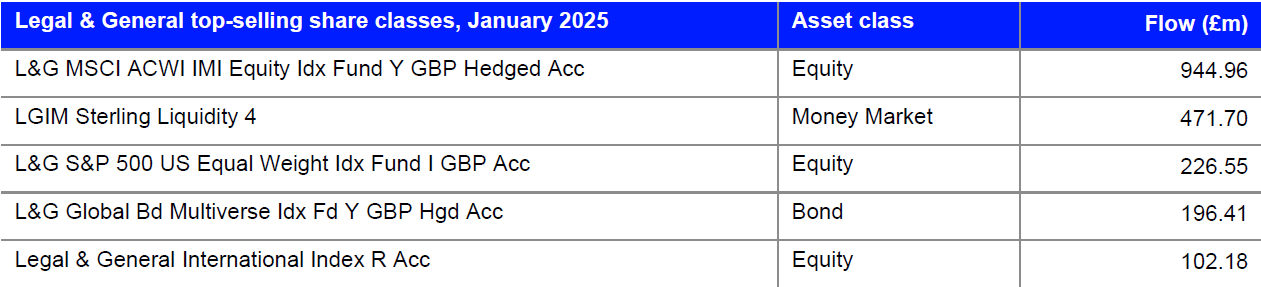
Legal & General takes second place for the month, with net flows of £1.74bn, with £1.34bn to equity funds, £414m to MMFs and £147m to bonds, as mixed asset funds saw outflows of £138m.
Source: LSEG Lipper

