
- Total flows to mutual funds for February were €76.91bn. This breaks down to: mutual fund flows (+€43.16 bn) and ETFs (+€33.75bn).
- Bond funds (+€25.83bn) were the best-selling asset type overall for February, followed by MMFs (+€25.28bn) and equity funds (+€23.07bn).
- ETFs continue to eat passive mutual funds’ lunch, as the former benefitted from inflows of €33.75bn while the latter shed €5.73bn in February (-€2.77bn YTD).
- European investors allocated €22.99bn into Money Market USD funds—the best-selling classification for the month.
- Turkish lira MMFs saw the largest sell off (-€3.43bn), with investors reversing their bets on the currency strengthening.
As S&P Slides, Investors Mull,
Buy on the Dips, or Run for the Hills?
Market sentiment had considered US equities (or the really big ones, at any rate) something of a one-way bet: broad, liquid markets, robust earnings growth and cash flows, all backstopped by an entrepreneurial culture the envy of the world. No other equity market was worth a look-in. But market sentiment is a fickle creature when it turns, and turn it did in the third week of February, from where the S&P 500 has headed resolutely down.
Whether you are in the “buy-on-the-dips” or “run-for-the-hills” camp, it’s undeniably a significant change in mood, although wobbles were also apparent at the end of December. Meanwhile, month-on-month flows look quite similar between January and February, with equity funds a close third behind money market funds and bonds.
At a more granular level, however, something of a sea change is apparent. Equity US flows for February are anaemic relative to prior months. What’s more, Equity US ETF flows are negative for the month. Given the importance of the vehicle for the asset class as a whole—much more so than in bonds, where its market penetration lags, if growing—this may be a canary in the coal mine moment. Overall, Equity Global has taken the lion’s share of the flows for the asset class, which is a good sign that investors are spreading their bets and waiting for a clearer market signal as to where to allocate. Though, of course, those spread bets are still a 60%-plus allocation to the US.
Meanwhile, February sees flows to bond funds exceed those of MMFs. There’s a certain logic here: tight spreads and high base rates have made for a good argument to hunker down in cash since central banks started cantering after runaway inflation in 2022. However, if the trend is to monetary loosening combined with higher spending, curves should steepen, motivating a move further out on the curve in search of yield. There are still many “ifs” abroad, however, not least that inflation has not been laid to rest.
Asset Type Flows
Total flows to mutual funds for February were €76.91bn. This breaks down to: mutual fund flows (+€43.16 bn) and ETFs (+€33.75bn).
Asset Type Flows February 2025
Bond funds (+€25.83bn) were the best-selling asset type overall for February 2025, followed by MMFs (+€25.28bn) and equity funds (+€23.07bn). At some considerable distance followed mixed assets (+€2bn), alternatives (+€1.34bn) and commodities (€0.73bn) funds, while “other” (-€0.41bn) and real estate funds (-€0.93bn) faced outflows.
Graph 1: Estimated Net Flows by Asset and Product Type – February 2025 (in bn EUR)

Source: LSEG Lipper
Asset Type Flows Year to Date
Estimated overall net flows in the European fund industry up to €153.11bn for the first two months of the year, breaking down to €90.38bn for mutual funds and €62.73bn for ETFs.
At the top of the list, MMFs (+€52.39bn) are ahead of bond funds (+€49.46bn) YTD, showing that investors have shifted their preference from cash to bonds on a month-to-month basis despite the enduring attractions of cash in a market where alarm klaxons are sounding. We have been in an environment characterised by flat-to-invested yield curves. However, rate cuts will pull the short end of the yield curve down, while increasing fiscal commitments (hello Germany) will act as an upward pressure further out. Whether this is what’s happening, or the shuffling of the pack can simply be ascribed to noise in a market where these allocations are similar remains to be seen.
As with the single-month data, equity fund flows follow on closely behind (+€47.25bn) and, again like the single month data, it’s dominated by ETF flows, with mutual funds showing net outflows for the asset class of €0.99bn.
Graph 2: Estimated Net Sales by Asset and Product Type, January 1 – February 28, 2025 (€bn)

Source: LSEG Lipper
Flows for all other asset types fall considerably behind: with mixed assets (+€5.35bn) and commodity (€0.83bn) funds seeing modest YTD inflows, as “other” (-€0.4bn), alternatives (-€0.54bn), and real estate (-€1.22bn) saw relatively small redemptions.
Fund Flows Active vs Passive Products
ETFs continue to eat passive mutual funds’ lunch, as the former benefitted from inflows of €33.75bn as the latter shed €5.73bn in February (-€2.77bn YTD).
Graph 3: Estimated Net Flows by Management Approach and Product Type, February 2025 (LHS);
January 1 – February 28, 2025 (RHS)
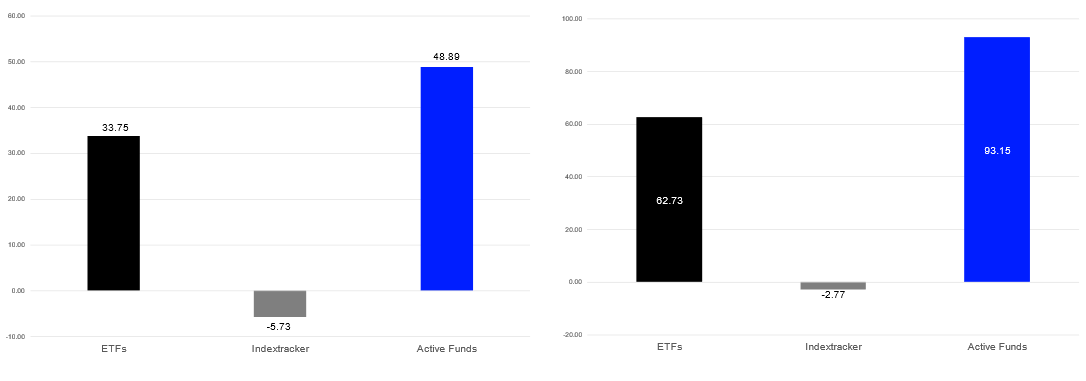
Source: LSEG Lipper
ETFs still lag active mutual funds, as can be seen from graph 3, above. However, that picture changes markedly when MMFs are stripped out. YTD, flows to long-term assets in ETFs were €58.33bn, while mutual funds netted €44.46bn, with the bulk of this going to equity ETFs.
Fund Flows by Lipper Global Classifications
Fund Flows by Lipper Global Classifications, February 2025
Faced with tumbling US stocks, softening economic data in the country, and an increase in global uncertainty around tariffs and geopolitics, European investors chose to plough €22.99bn into Money Market USD funds in February. This clearly isn’t a one-way street, as investors are having to play off pressure on the Fed to drop rates off the back of a weakening economy versus the greenback’s status as a haven currency, and the still attractive rates on cash. For now, the latter is winning the argument.
Money Market EUR were also in the black (+€2.59bn), while Money Market GBP shed €1.33bn over the month.
Meanwhile, with US equities taking a pummelling, their European equivalents begin to look more attractive and saw inflows of €1.49bn. However, their ex-UK equivalents saw outflows of €2.72bn, which may be an indication that UK investors have yet to get on board this particular trade.
Graph 4: Ten Best- and Worst Lipper Global Classifications by Estimated Net Sales, February 2025 (€bn)
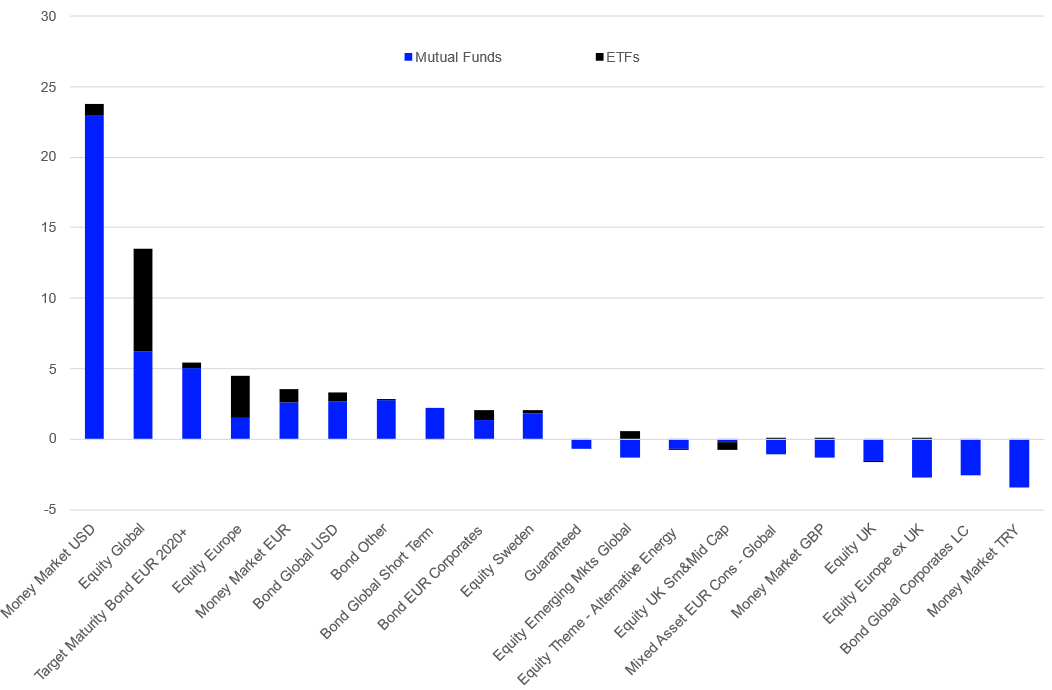
Source: LSEG Lipper
To the far right of the chart, it’s a tad surprising to see that Turkish lira MMFs have seen the largest sell off for February, but it’s there in black and white, with these funds selling off to the tune of €3.43bn of outflows for the month. The lira has been in long-term decline, but higher central bank rates in 2024 tempted investors, from investment banks to hedge funds, into the money. The lira had trended up against the euro since late summer, but then resumed its downward journey from mid-January, and investors have pulled their cash.
It’s worth noting that although Equity US funds saw net flows of €914m for February—well down on January’s €10.9bn—ETF flows for the classification were negative to the tune of €1.44bn.
Fund Flows by Lipper Global Classifications, Year to Date
The slump in Equity US sales sees Equity Global regain the top spot despite the strong aggregate sales for MMFs. Equity Global has netted €23.76bn over the first two months of the year, with ETF inflows accounting for €15.04bn of this. Allocations to MMFs were also strong, whether to their USD (+€20.97bn) or EUR (+€18.67bn) iterations. Money Market Global also netted €5.06bn.
Given the decent yield still available on cash and the febrile nature of markets currently, it’s not hard to see the attractions of cash. However—a point we make regularly— estimated flows in money market sectors are not only a reflection of asset allocation decisions of investors, as these products are also used by corporates as a replacement for cash accounts.
What’s interesting is that, despite the strong sales for bond funds overall, this isn’t reflected strongly in graph 5, with only Bond Global USD (+6.43bn) and Bond Other (+€5.41bn) appearing in the top 10. Allocations here are therefore more diversified than in the equity space.
Graph 5: Ten Best- and Worst Lipper Global Classifications by Estimated Net Sales, January 1 – February 28, 2025 (€bn)
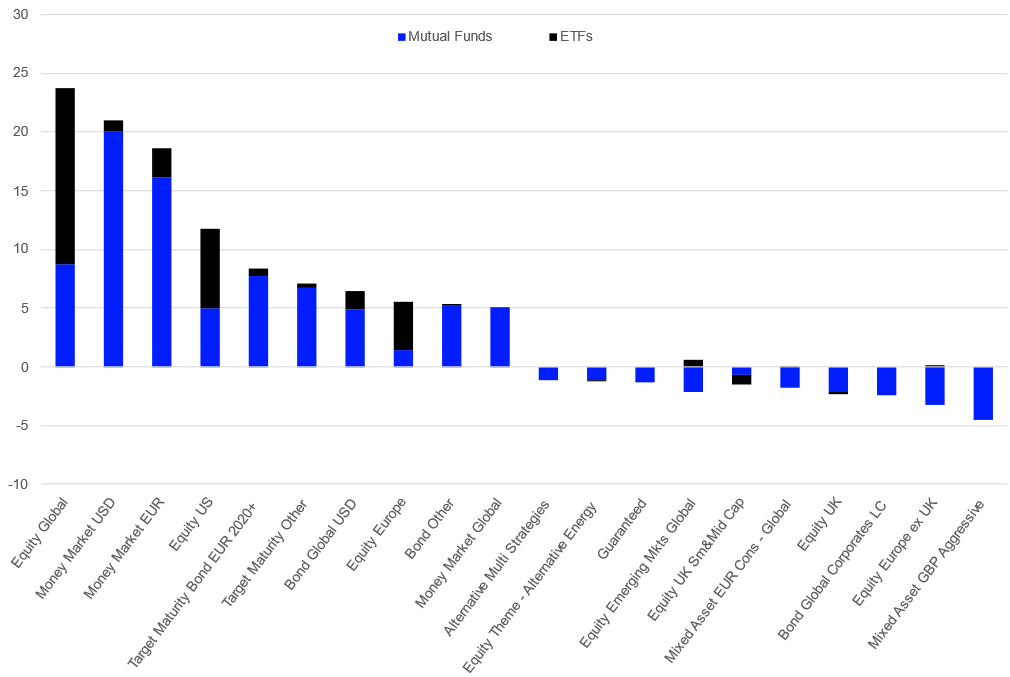
Source: LSEG Lipper
Despite the positive first two months for UK equities, redemption misery seems a given for Equity UK (-€2.32bn) and Equity UK Small & Mid (-€1.48bn). While there surely can’t be that much more selling of UK equities for UK pension funds to do, there’s likely more to come from UK retail and wholesale, as portfolio benchmarks migrate from domestic to global.
As we’ve explained elsewhere, the strong positive sales for Target Maturity Other and the outflows for Mixed Asset GBP Aggressive are likely a reallocation within the fund suite of one specific large asset manager.
Fund Flows by Promoters
Fund Flows by Promoters, February 2025
JPMorgan (+€11.24 bn) was the best-selling fund promoter in Europe for February, despite negligible ETF sales. This was followed by BlackRock (+10.79bn–€12.46bn to ETFs), DWS Group (+5.64bn), Goldman Sachs (+€4.6bn), and Amundi (+€3.9bn).
Graph 6: Ten Best-Selling Fund Promoters in Europe, February 2025 (€bn)

Source: LSEG Lipper
Fund Flows by Promoters, Year to Date
BlackRock (+€19.33bn) is the best-selling fund promoter in Europe YTD, ahead of JPMorgan (+€12.73 bn), Amundi (+€10.69bn), DWS (+€10.48bn), and HSBC (+€9.62bn).
Graph 7: Ten Best-Selling Fund Promoters in Europe, January 1 – February 28, 2025 (€bn)
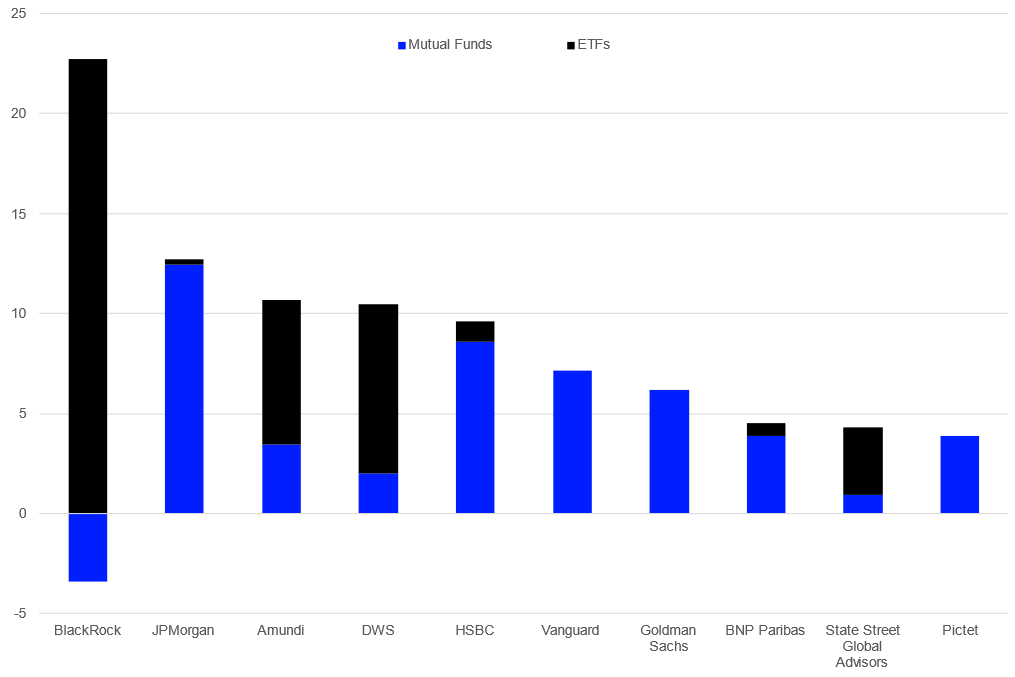
Source: LSEG Lipper

