February 2025 was another month with strong inflows for the European ETF industry.
These inflows occurred in a volatile market environment in which investors around the globe acted nervous over any political and economic news. Investor sentiment was impacted by the discussions around tariffs by the U.S. president and potential tit-for-tat reactions from the markets which are the targets of the new tariffs. That said, the tariffs are seen as a kind of trade war between the U.S. and the rest of the world by some market observers.
When it comes to this, investors were concerned about a political shift to the right as a result of the general election in Germany in February. Since, these concerns did not materialize, German equities started a relief rally, as a possible great coalition seem to be in favor of the investors.
Meanwhile central banks around the globe adjusted their policies to the current environment by cutting interest rates. These decisions reflect central banks’ efforts to navigate economic challenges, including trade tensions, inflationary trends, and the high market volatility, to support their local economies.
Nevertheless, fears of increasing debt in the U.S. and other major economies might be the driver for the “relatively low” estimated net inflows into bond ETFs, while the still somewhat inverted yield curves might be the drivers for the inflows into money market ETFs.
That said, inverted yield curves and especially long-term inverted yield curves are seen as an early indicator for a possible recession. However, there is only a very limited number of indicators which are sending negative signals for the economic growth in the U.S. and other major economies. With regard to this, it is noteworthy that most of these negative indicators get offset by positive signals from other indicators. But even as it looks like the yield curves are slowly normalizing, this does not mean that there is no recession possible in the major economies around the globe. This is especially true as some major economies, such as Germany, lack economic growth and may need lower interest rates as stimulus. Despite these headwinds, the positive effects of lower interest rates seem to be more important for investors than the current state of some economies.
From an ETF industry perspective, the performance of the underlying markets led, in combination with the estimated net flows, to increasing assets under management (from €2,162.3 bn as of January 31, 2025, to €2,203.0 bn at the end of February). At a closer look, the increase in assets under management of €40.7 bn for February was driven by estimated net inflows (+€33.8 bn), while the performance of the underlying markets contributed (€6.9 bn) to the growth of assets under management.
Assets Under Management
As for the overall structure of the European ETF industry, it was not surprising equity funds (€1,1664.3 bn) held the majority of assets, followed by bond funds (€425.9 bn), money market products (€60.0 bn), commodities products (€41.2 bn), alternatives products (€7.4 bn), and mixed-assets funds (€4.2 bn).
Given the current market environment, it is no surprise that the overall assets under management in the European ETF industry (€2,203.0 bn) are going from one all-time high to the next month after month. With regard to this, it is no surprise that the assets under management for equity, bond, mixed assets, and money market ETFs also marked an all-time high at the end of the month.
Graph 1: Market Share, Assets Under Management in the European ETF Segment by Asset Type, February 28, 2025

Source: LSEG Lipper
ETF Flows by Asset Type
The European ETF industry enjoyed strong estimated net inflows (+€33.8 bn) over the course of February which marked the highest monthly inflows on record and were way above the rolling 12-month average (€23.5 bn). These inflows drove the overall inflows in ETFs up to €62.7 bn for the year 2025 so far.
If European ETFs can maintain their current level of inflows, the overall inflows for the year 2025 will reach a new all-time high, with estimated net inflows between €300.0 bn and €360.0 bn.
The inflows in the European ETF industry for February were driven by equity ETFs (+€24.3 bn), followed by bond ETFs (+€6.9 bn), money market ETFs (+€1.7 bn), commodities ETFs (+€0.6 bn), mixed-assets ETFs (+€0.2 bn), and alternatives ETFs (+€0.1 bn).
Graph 2: Estimated Net Sales by Asset Type, February 2025 (Euro Billions)

Source: LSEG Lipper
Given the current market environment, it was no surprise to see high inflows into ETFs led by equity products over the course of February 2025. This repeats a trend we have seen in the past where ETFs enjoyed high inflows during times of market turmoil while mutual funds faced significant outflows.
Assets Under Management by Lipper Global Classifications
In order to examine the European ETF markets in further detail, a review of the Lipper global classifications will lead to more insights on the structure and concentration of assets within the European ETF industry. At the end of February 2025, the European ETF market was split into 175 different peer groups. The highest assets under management at the end of February were held by funds classified as Equity U.S. (€568.8 bn), followed by Equity Global (€406.2 bn), Equity Europe (€98.2 bn), Equity Emerging Markets Global (€90.5 bn), and Equity Eurozone (€75.6 bn). These five peer groups accounted for 56.25% of the overall assets under management in the European ETF segment, while the 10-top classifications by assets under management accounted for 66.34%.
Overall, 17 of the 1,175 peer groups each accounted for more than 1% of assets under management. In total, these 17 peer groups accounted for €1,687.4 bn, or 76.59%, of the overall assets under management.
Graph 3: Ten Largest Lipper Global Classifications by Assets Under Management, February 28, 2025 (Euro Billions)

Source: LSEG Lipper
In addition, it was noteworthy that the rankings of the largest classifications saw some movement in single positions over the last few years. As the positions of the classifications had been quite stable in the past, this indicates that European investors use ETFs to trade according to their market views. Even as some of these positions might be core holdings, once investors got into risk-off mode they also reduced their exposure to core asset classes.
That said, the ranking changes at the top of the league table which happened during the COVID-19 pandemic have started to reverse. Nevertheless, these numbers showed assets under management by Lipper global classifications continued to be highly concentrated in the European ETF industry.
The peer groups on the other side of the table showed some funds in the European ETF market are quite low in assets and their constituents may face the risk of being closed in the near future. They are obviously lacking investor interest and might, therefore, not be profitable for their respective fund promoters (Please read our report: “Is there a consolidation ahead in the European ETF industry?” for more details on this topic).
Graph 4: Ten Smallest Lipper Global Classifications by Assets Under Management, February 28, 2025 (Euro Billions)

Source: LSEG Lipper
ETF Flows by Lipper Global Classifications
The net inflows of the 10 best-selling Lipper classifications accounted for €22.5 bn. In line with the overall sales trend for February, equity peer groups (+€21.5 bn) gathered the majority of flows by asset type on the table of the 10 best-selling peer groups by estimated net inflows. Nevertheless, it was surprising that there was no bond classification on the table of the 10 best-selling classifications for February 2025. Given the overall fund flow trend in the European ETF industry, it was not surprising that Equity Global (+€7.3 bn) was the best-selling Lipper global classification for February. It was followed by Equity Europe (+€3.0 bn) and Equity Eurozone (+€2.6 bn). Given the long-term trend for the estimated fund flows by Lipper classifications, it is surprising that Equity U.S. can’t be found on the list of 10 best-selling Lipper classifications for February 2025.
The flows into money market products in the European ETF industry have further normalized over the course of February. Nevertheless, Money Market EUR (+€1.0 bn) is still on the table of the 10 best-selling Lipper classifications for the month despite the fact that money market products in general are not a core asset type within the European ETF industry. The estimated inflows in money market products may be an indicator that European investors have become cautious when it comes to their positioning on the respective yield curves and may want to take profit from the elevated interest rate level on the short end of the yield curves before they return to their normal shape.
More generally, these numbers showed the European ETF segment is also highly concentrated when it comes to fund flows by classification. Generally speaking, one would expect the flows into ETFs to be concentrated since investors often use ETFs to implement their market views and short-term asset allocation decisions. These products are made and, therefore, are easy to use for these purposes.
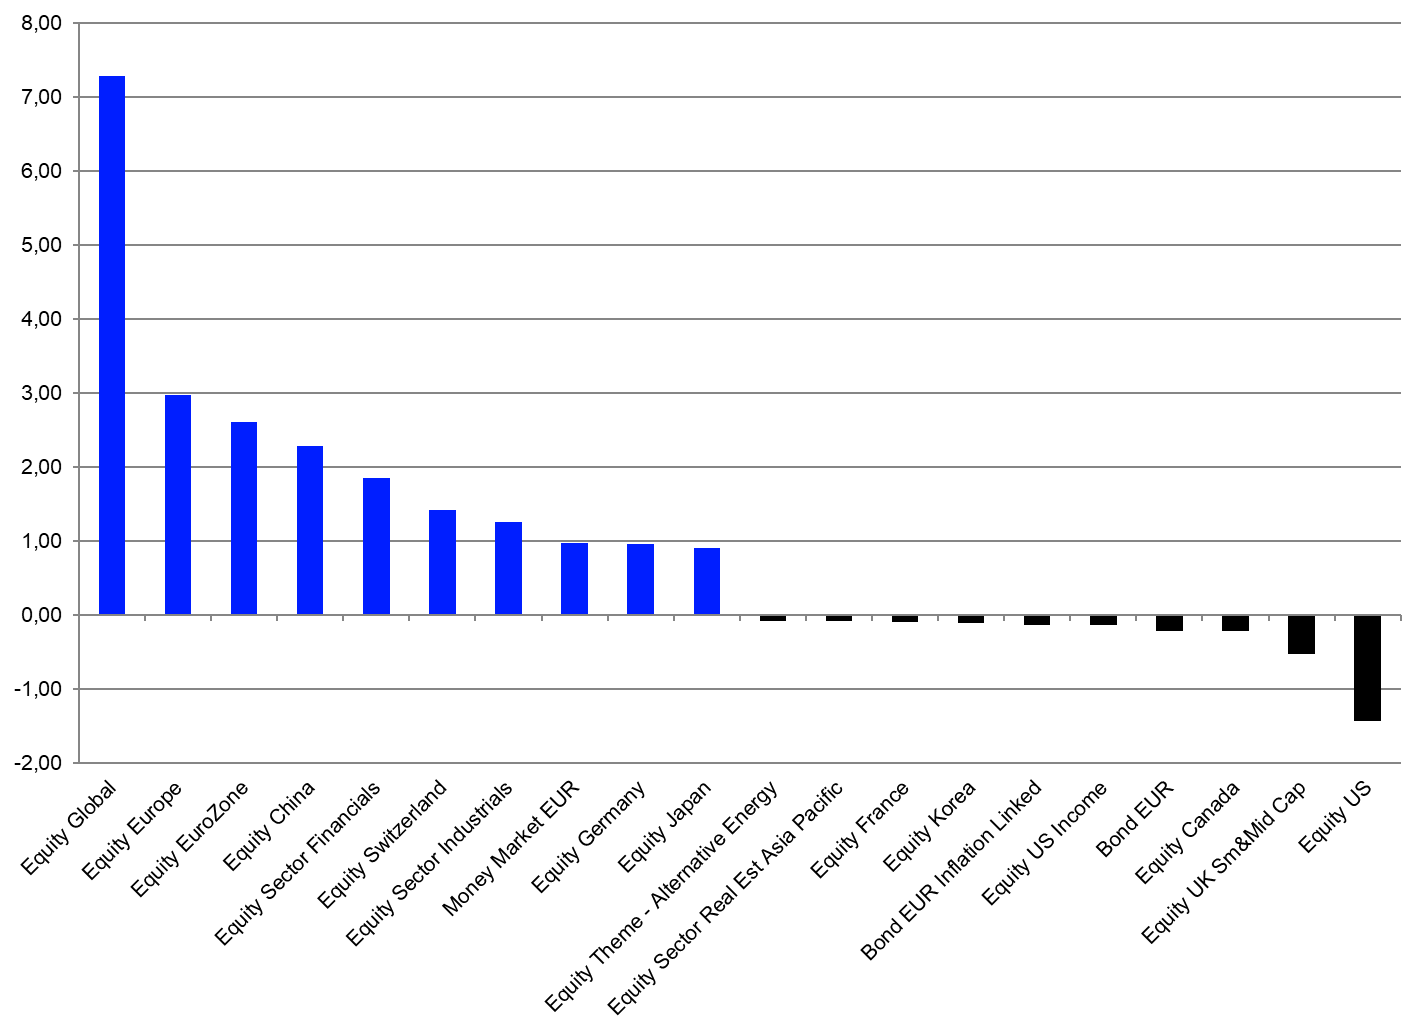
Graph 5: Ten Best- and Worst-Lipper Global Classifications by Estimated Net Sales, February 2025 (Euro Billions)
Source: LSEG Lipper
On the other side of the table, the 10 peer groups with the highest estimated net outflows for February accounted for €3.1 bn in outflows. These outflows were below the outflows for 10 peer groups with the highest outflows for January 2025 (€3.2 bn).
Equity U.S. (-€1.4 bn) was the classification with the highest outflows for the month. It was bettered by Equity UK Small & Mid Cap (-€0.5 bn), Equity Canada (-€0.2 bn), Bond EUR (-€0.2 bn), and Equity U.S. Income (-€0.1 bn).
Assets Under Management by Promoters
A closer look at assets under management by promoters in the European ETF industry also showed high concentration, with only 29 of the 62 ETF promoters in Europe holding assets at or above €1.0 bn. The largest ETF promoter in Europe—iShares (€948.8 bn)—accounted for 43.07% of the overall assets under management, far ahead of the number-two promoter—Amundi ETF (€284.8 bn)—and the number-three promoter—Xtrackers (€242.3 bn). (To learn more about the concentration of the European ETF market at the promoter level, please read our report: Spotlight on the concentration at the promoter level in the European ETF industry).
Graph 6: The 10 Largest ETF Promoters by Assets Under Management, February 28, 2025 (Euro Billions)

Source: LSEG Lipper
The 10-top promoters accounted for 94.13% of the overall assets under management in the European ETF industry. This meant, in turn, the other 52 fund promoters registering at least one ETF for sale in Europe accounted for only 5.87% of the overall assets under management.
ETF Flows by Promoters
Since the European ETF market is highly concentrated with regard to the assets under management by promoter, it was not surprising that eight of the 10 largest promoters by assets under management were among the 10-top selling ETF promoters for February. iShares was the best-selling ETF promoter in Europe for February (+€12.5 bn), ahead of Xtrackers (+€4.8 bn) and Vanguard (+€3.6 bn).
Graph 7: Ten Best-Selling ETF Promoters, February 2025 (Euro Billions)

Source: LSEG Lipper
The flows of the 10-top promoters accounted for estimated net inflows of €30.6 bn. As for the overall flow trend in February, it was clear that some of the 62 promoters (six) faced estimated net outflows (-€0.1 bn in total) over the course of the month.
Assets Under Management by ETFs
There were 4,051 instruments (primary share classes [3,513] and convenience share classes [538]) listed as ETFs in the Lipper database at the end of February. Regarding the overall market pattern, it was not surprising assets under management at the ETF level were also highly concentrated. Only 434 of the 3,513 ETFs (primary share classes = portfolios) held assets above €1.0 bn each. These ETFs accounted for €1,855.5 bn, or 84.22%, of the overall assets in the European ETF industry. The 10 largest ETFs in Europe accounted for €447.6 bn, or 20.32%, of the overall assets under management. (Please read our study: Is the European ETF industry dominated by only a few funds? to learn more about the concentration at the single-fund level in the European ETF industry).
Graph 8: The 10 Largest ETFs by Assets Under Management, February 28, 2025 (Euro Billions)

Source: LSEG Lipper
Estimated Net Flows on ETF Level
A total of 1,108 of the 3,513 ETFs (primary share classes = portfolios) analyzed in this report showed net inflows of more than €10,000 each for February, accounting for inflows of €53.7 bn. This meant the other 2,405 instruments faced no flows, or net outflows, for the month. Upon closer inspection, only 138 of the 1,108 ETFs posting net inflows enjoyed inflows of more than €100 m during February—for a total of €36.3 bn. The best-selling ETF for February was iShares MSCI China UCITS ETF USD Acc, which enjoyed estimated net inflows of €1.4 bn. It was followed by iShares Core MSCI World UCITS ETF USD (Acc) (+€1.3 bn) and Vanguard FTSE All-World UCITS ETF USD Dis (+€0.8 bn).
Graph 9: The 10 Best-Selling ETFs, February 2025 (Euro Billions)

Source: LSEG Lipper
The flow pattern at the fund level indicated there was a lot of turnover and rotation during February, but it also showed the concentration of the European ETF industry even better than the statistics at the promoter or classification levels since the 10 best-selling ETFs account for inflows of €9.8 bn.
Given its size and the overall trend for net sales at the promoter level, it was surprising that only four of the 10 best-selling funds for February were promoted by iShares. These iShares ETFs accounted for estimated net inflows of €4.2 bn.
This article is for information purposes only and does not constitute any investment advice.
The views expressed are the views of the author, not necessarily those of Lipper or LSEG.

