February 2025 was another month with strong inflows for the global ETF industry.
These inflows occurred in a volatile market environment in which investors around the globe acted nervous over any political and economic news. Investor sentiment was impacted by the discussions around tariffs imposed by the U.S. president and potential tit-for-tat reactions from the markets which are the targets of the new tariffs. That said, the tariffs are seen as a kind of trade war between the U.S. and the rest of the world by some market observers.
When it comes to this, investors were concerned about a political shift to the right as a result of the general election in Germany in February. Since these concerns did not materialize, German equities started a relief rally, as a possible great coalition seems to be in favor of investors.
Meanwhile, central banks around the globe adjusted their policies to the current environment by cutting interest rates. These decisions reflect central banks’ efforts to navigate economic challenges, including trade tensions, inflationary trends, and the high market volatility, to support their local economies.
Nevertheless, fears of increasing debt in the U.S. and other major economies might be the driver for the “relatively low” estimated net inflows into bond ETFs, while the still somewhat inverted yield curves might be the drivers for the inflows into money market ETFs.
That said, inverted yield curves and especially long-term inverted yield curves are seen as an early indicator for a possible recession. However, there is only a very limited number of indicators which are sending negative signals for economic growth in the U.S. and other major economies. With regard to this, it is noteworthy that most of these negative indicators get offset by positive signals from other indicators. But even as it looks like the yield curves are slowly normalizing, this does not mean that there is no recession possible in the major economies around the globe. This is especially true since some major economies, such as Germany, lack economic growth and may need lower interest rates as stimulus. Despite these headwinds, the positive effects of lower interest rates seem to be more important for investors than the current state of some economies.
From an ETF industry perspective, the performance of the underlying markets led, in combination with the estimated net flows, to increasing assets under management (from $14,743.7 bn as of January 31, 2025, to $14,786.9 bn at the end of February). At a closer look, the increase in assets under management of $43.2 bn for February was driven by estimated net inflows contributed (+$164.8 bn), while the negative performance of the underlying markets deducted (-$121.6 bn) from the overall assets under management.
Assets Under Management by Asset Type
As for the overall structure of the global ETF industry, it was not surprising equity ETFs ($11,498.8 bn) held the majority of assets, followed by bond ETFs ($2,597.4 bn), commodities ETFs ($242.2 bn), alternatives ETFs ($187.8 bn), “other” ETFs ($105.5 bn), money market ETFs ($99.4 bn), and mixed-assets ETFs ($55.7 bn).
Despite the current market environment, it is no surprise that the assets under management for bond, commodities, mixed-assets, and money market ETFs marked an all-time high at the end of the month. This is because the main headwinds for the assets under management are witnessed in the equity markets.
Graph 1: Market Share, Assets Under Management in the Global ETF Industry by Asset Type, February 28, 2025
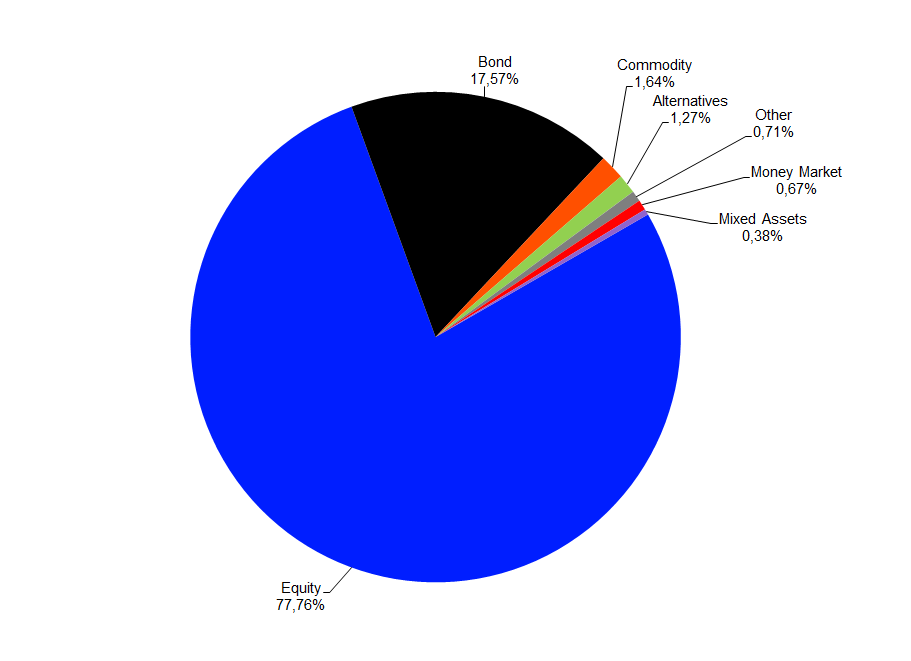
Source: LSEG Lipper
ETF Flows by Asset Type
The global ETF industry enjoyed strong estimated net inflows (+$164.8 bn) over the course of February despite the headwinds in the equity markets. These inflows drove the overall inflows in ETFs up to $321.9 bn for the year 2025 so far.
The inflows in the global ETF industry for February were driven by equity ETFs (+$101.3 bn), followed by bond ETFs (+$51.4 bn), commodities ETFs (+$8.2 bn), money market ETFs (+$2.8 bn), and mixed-assets ETFs (+$2.2 bn), while alternatives ETFs (-$1.2 bn) faced outflows.
Graph 2: Estimated Net Sales by Asset Type, February 2025 (USD Billions)
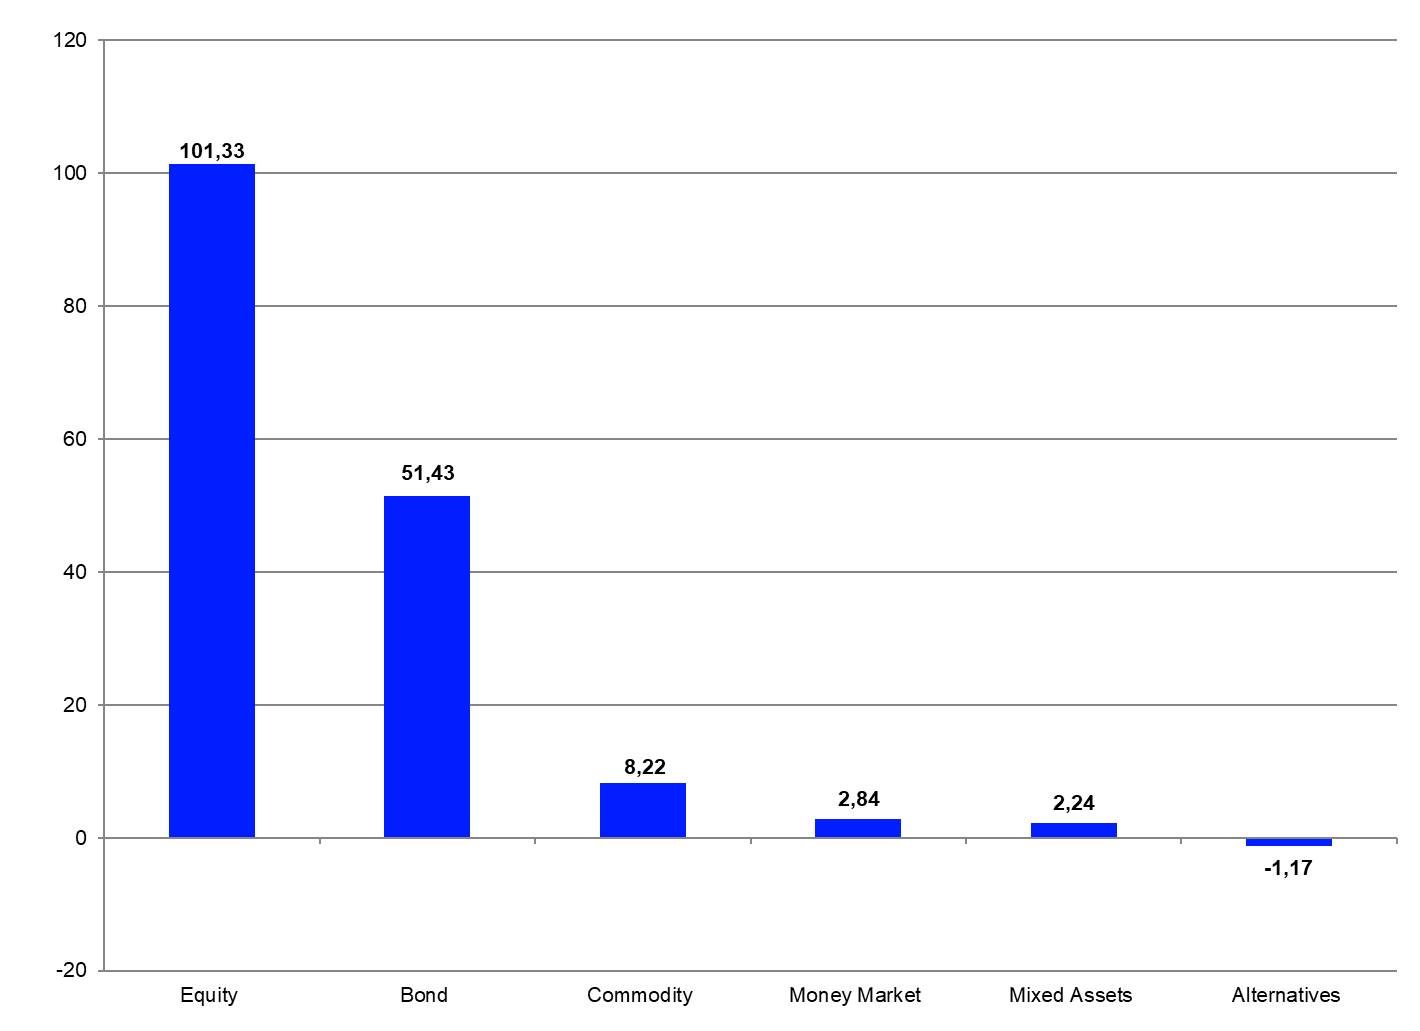
Source: LSEG Lipper
Assets Under Management by Lipper Global Classifications
In order to examine the global ETF industry in further detail, a review of the Lipper global classifications will lead to more insights on the structure and concentration of assets within the global ETF industry. At the end of February 2025, the global ETF market was split into 290 different peer groups. The highest assets under management at the end of February were held by funds classified as Equity U.S. ($5,340.7 bn), followed by Equity U.S. Small & Mid Cap ($900.3 bn), Equity Global ex U.S. ($801.9 bn), Equity Japan ($601.3 bn), and Equity Global ($601.3 bn). These five peer groups accounted for 55.76% of the overall assets under management in the global ETF industry, while the 10-top classifications by assets under management accounted for 69.22%.
Overall, 16 of the 290 peer groups each accounted for more than 1% of assets under management. In total, these 16 peer groups accounted for $11,418.3 bn, or 77.22%, of the overall assets under management.
Graph 3: Ten Largest Lipper Global Classifications by Assets Under Management, February 28, 2025 (USD Billions)
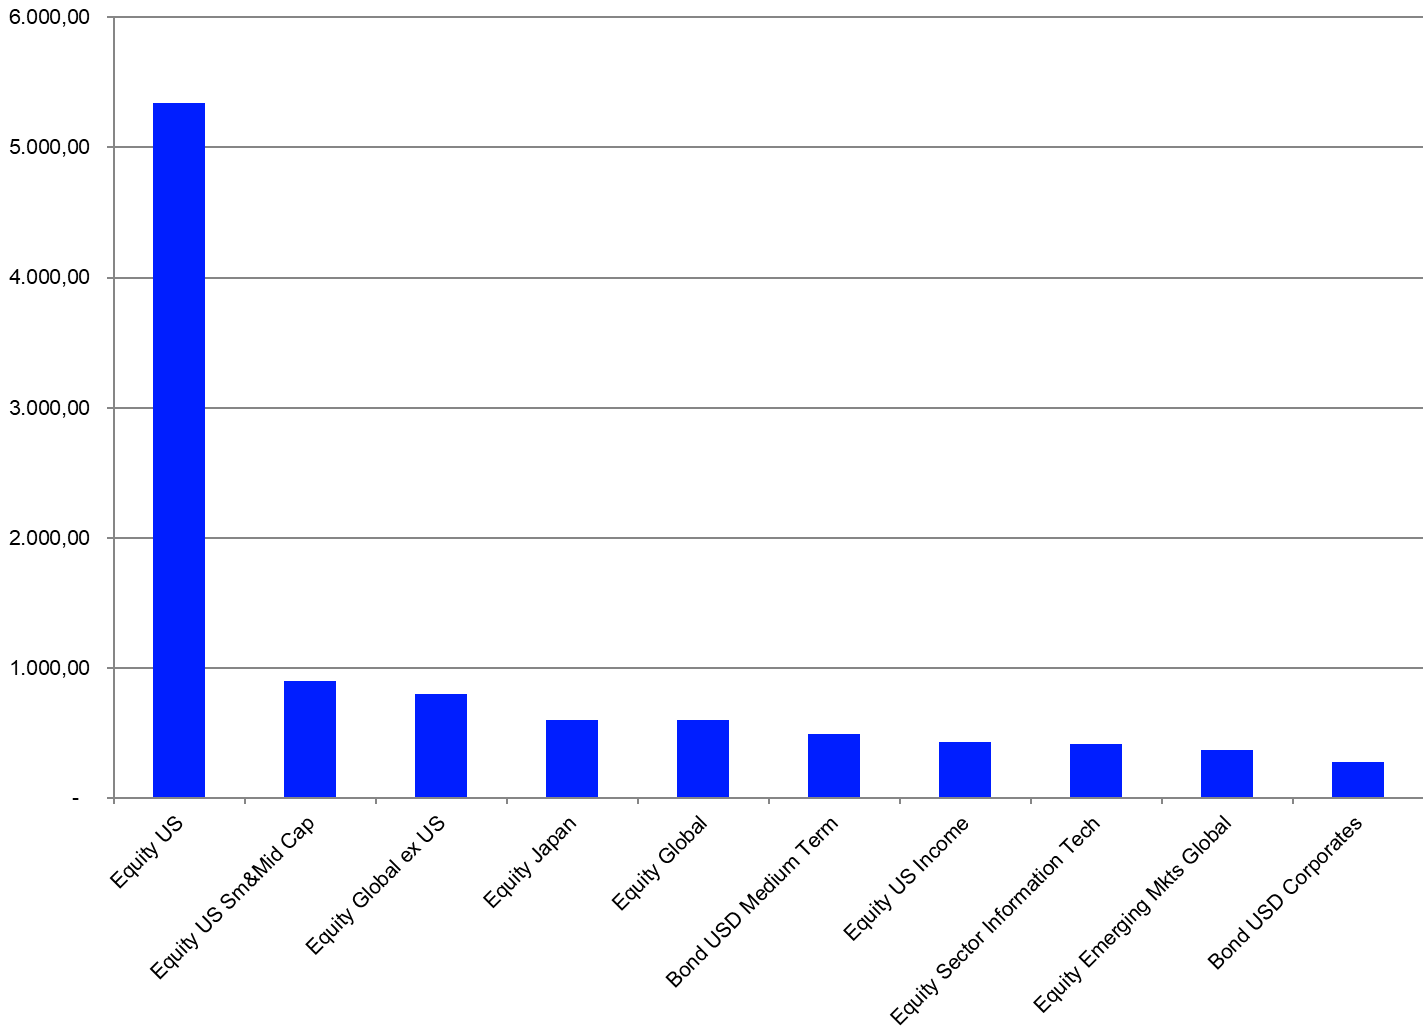
Source: LSEG Lipper
The peer groups on the other side of the table showed some funds in the global ETF market are quite low in assets and their constituents may face the risk of being closed in the near future. They are obviously lacking investor interest and might, therefore, not be profitable for their respective fund promoters.
Graph 4: Ten Smallest Lipper Global Classifications by Assets Under Management, February 28, 2025 (USD Billions)
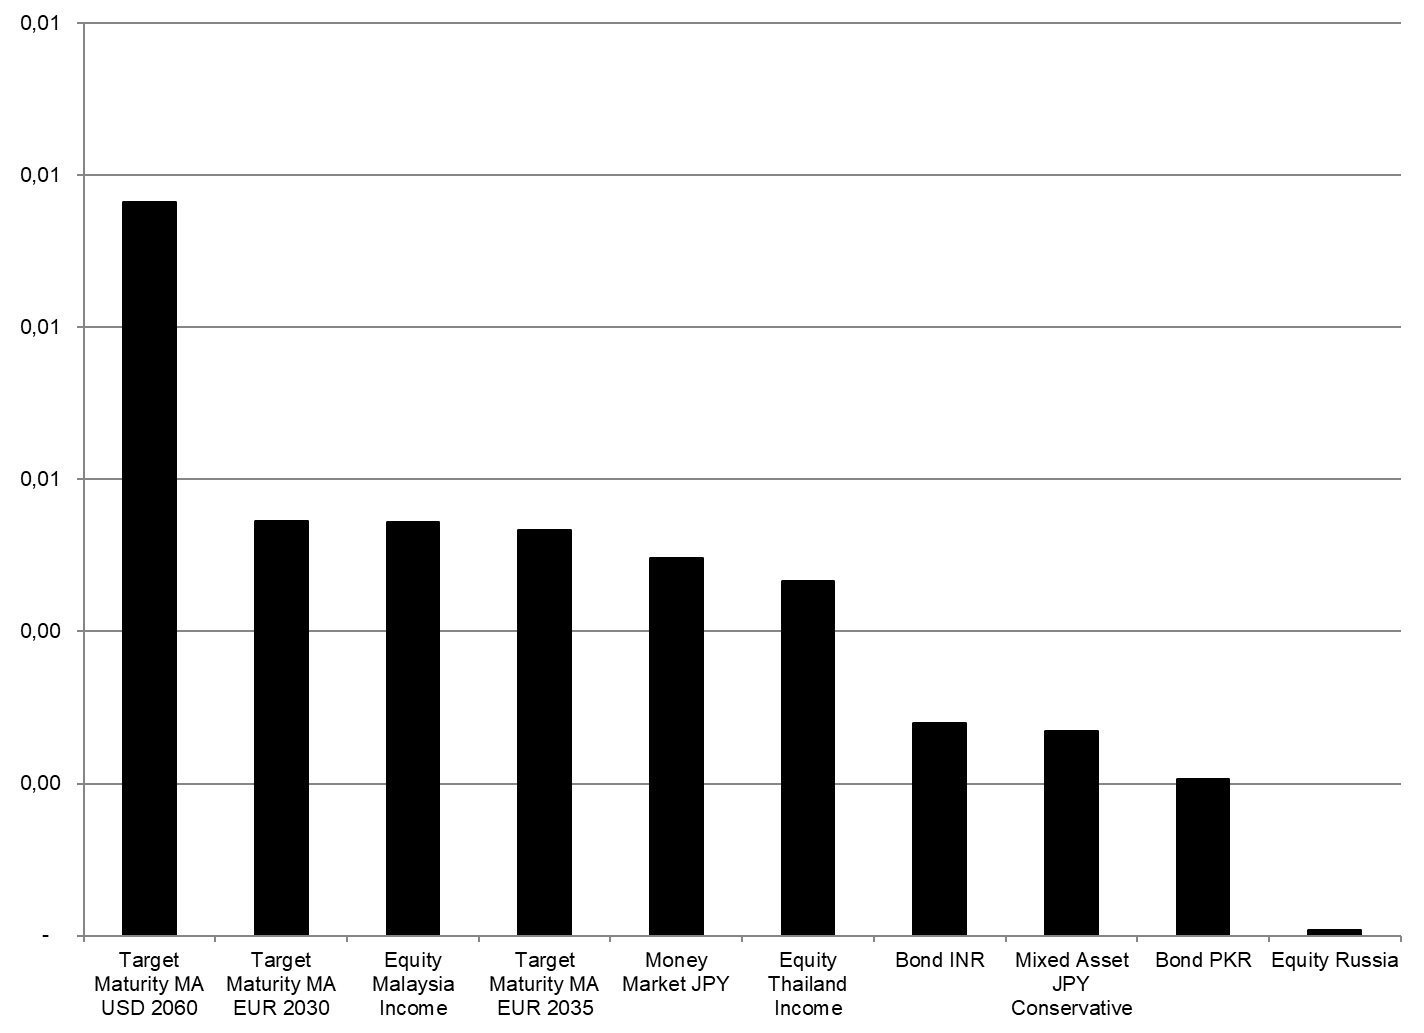
Source: LSEG Lipper
ETF Flows by Lipper Global Classifications
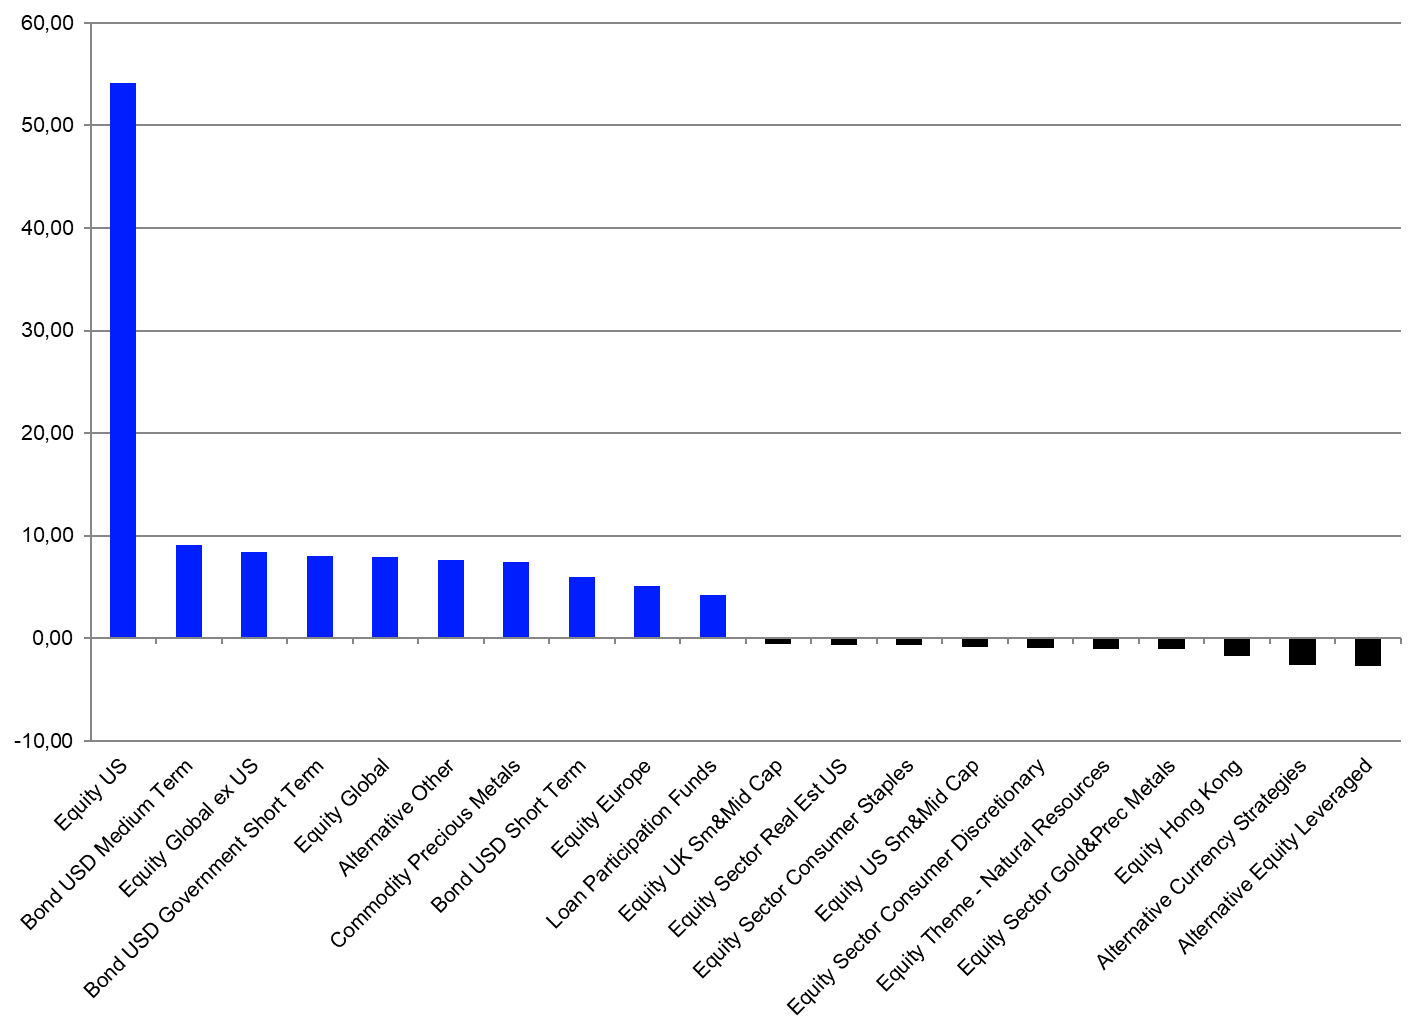
The net inflows of the 10 best-selling Lipper classifications accounted for $117.8 bn. In line with the overall sales trend for February, equity peer groups (+$67.6 bn) gathered the majority of flows by asset type on the table of the 10 best-selling classifications by estimated net inflows for February 2025. That said, compared with the concentration of flows for the single regions, the 10 best-selling Lipper classifications are more diversified on the global level. Given the overall fund flow trend in the global ETF industry, it was not surprising that Equity U.S. (+$54.1 bn) was the best-selling Lipper global classification for February. It was followed by Bond USD Medium Term (+$9.1 bn) and Equity Global ex U.S. (+$8.4 bn).
Since money market is in general not considered a core asset type within the global ETF industry, it is not surprising that there were no money market products on the table for the best-selling classifications for the global ETF industry.
More generally, these numbers showed the global ETF segment is somewhat highly concentrated when it comes to the estimated net flows by classification. Generally speaking, one would expect the flows into ETFs to be concentrated since investors often use ETFs to implement their market views and short-term asset allocation decisions. These products are made and, therefore, are easy to use for these purposes.
Graph 5: Ten Best- and Worst-Lipper Global Classifications by Estimated Net Sales, February 2025 (USD Billions)
Source: LSEG Lipper
On the other side of the table, the 10 peer groups with the highest estimated net outflows for February accounted for $12.9 bn in outflows.
Alternative Equity Leveraged (-$2.7 bn) was the classification with the highest outflows for the month. It was bettered by Alternative Currency Strategies (-$2.6 bn), Equity Hong Kong (-$1.7 bn), Equity Sector Gold & Precious Metals (-$1.1 bn), and Equity Theme – Natural Resources (-$1.0 bn).
Assets Under Management by Promoters
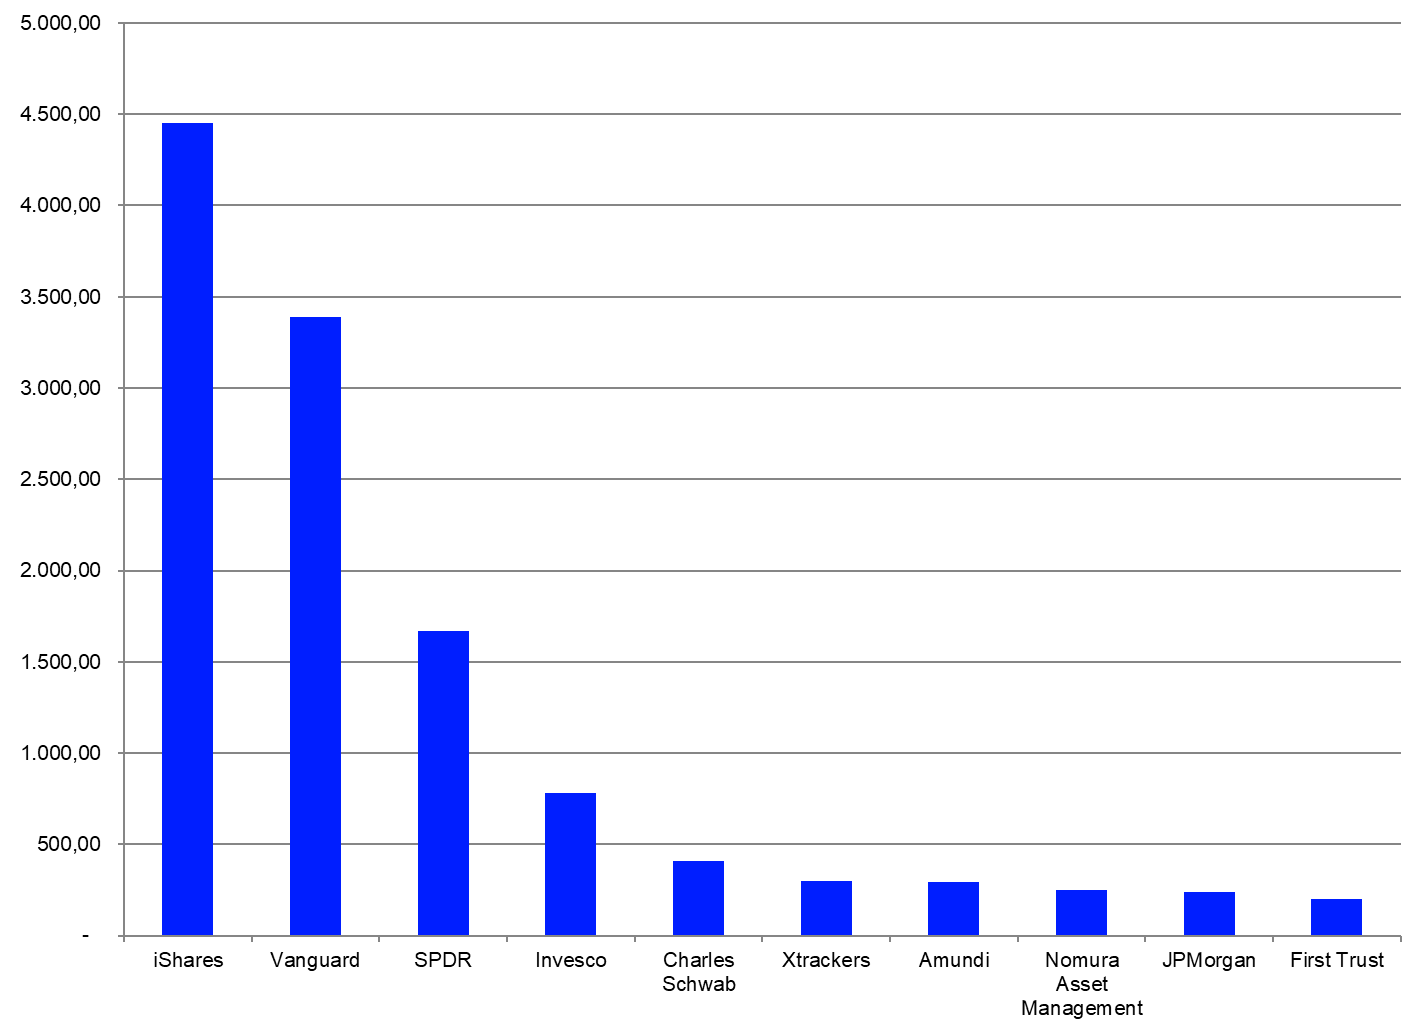
A closer look at assets under management by promoters in the global ETF industry also showed high concentration, with only 117 of the 652 ETF promoters in the global ETF industry holding assets at or above $1.0 bn. The largest ETF promoter in the global ETF industry—iShares ($4,450.1 bn)—accounted for 30.09% of the overall assets under management, ahead of the number-two promoter—Vanguard ($3,389.6 bn)—and the number-three promoter—SPDR ($1,671.7 bn).
Graph 6: The 10 Largest ETF Promoters by Assets Under Management, February 28, 2025 (USD Billions)
Source: LSEG Lipper
The 10-top promoters accounted for 81.05% of the overall assets under management in the global ETF industry. This meant, in turn, the other 642 fund promoters registering at least one ETF for sale in Europe accounted for only 18.95% of the overall assets under management. These numbers show that the assets under management at the promoter level in the global ETF industry are somewhat more diversified than in the single regions.
ETF Flows by Promoters
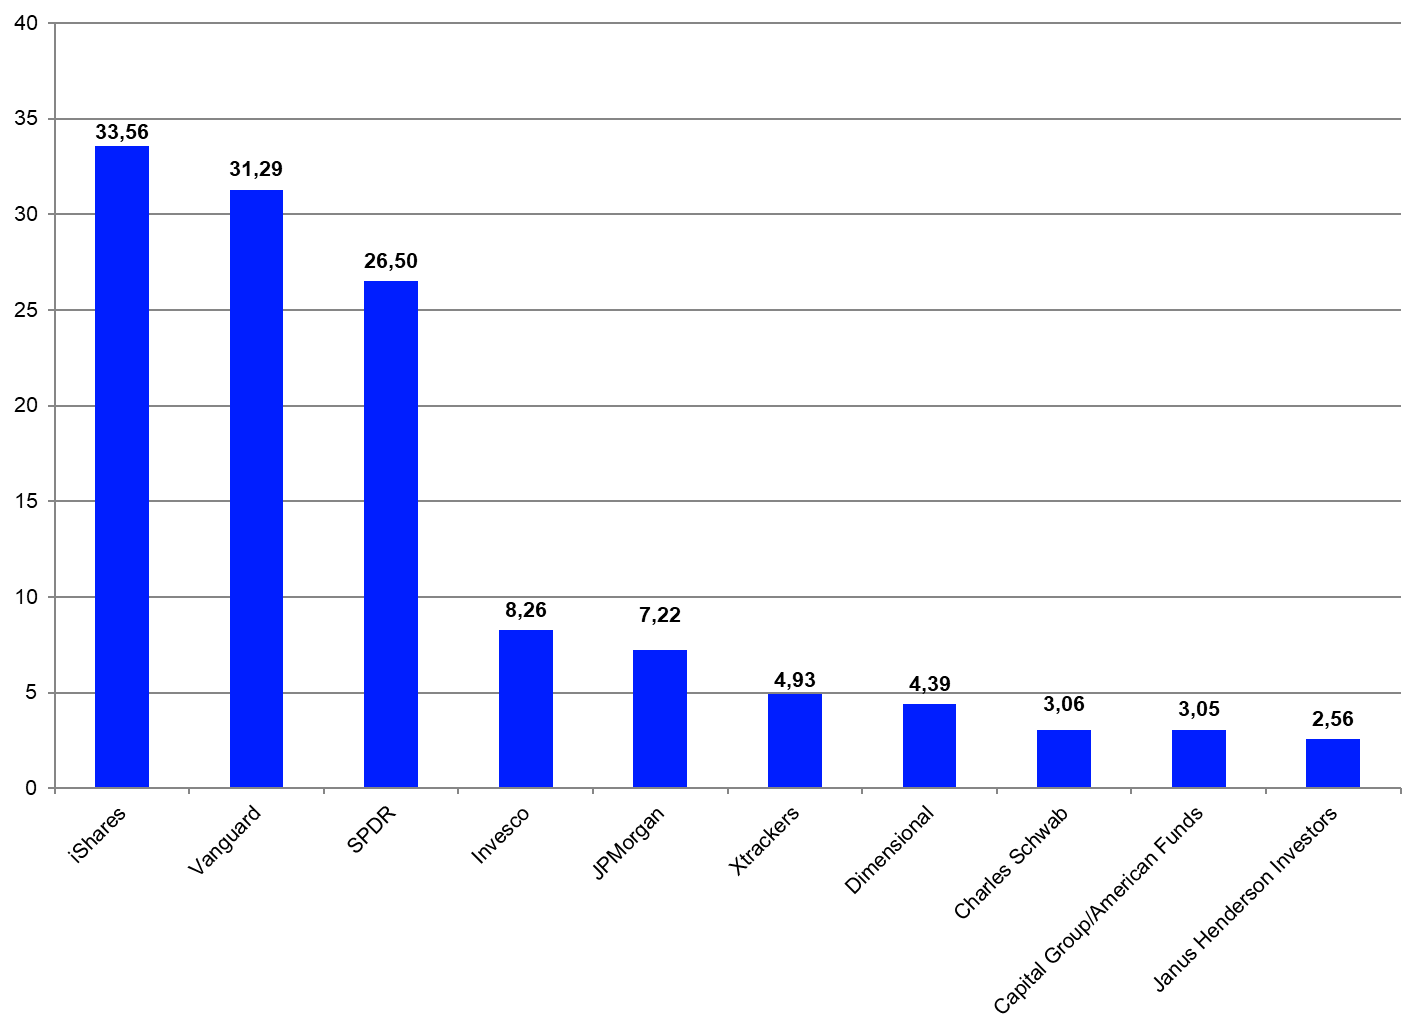
Since the global ETF industry is highly concentrated with regard to the assets under management by promoter, it was not surprising that seven of the 10 largest promoters by assets under management were among the 10-top selling ETF promoters for February. iShares was the best-selling ETF promoter in the global ETF industry for February (+$33.6 bn), ahead of Vanguard (+$31.3 bn) and SPDR (+$26.5 bn).
Graph 7: Ten Best-Selling ETF Promoters, February 2025 (USD Billions)
Source: LSEG Lipper
The flows of the 10-top promoters accounted for estimated net inflows of $124.8 bn. As for the overall flow trend in February, it was clear that some of the 652 promoters (142) faced estimated net outflows (-$10.9 bn in total) over the course of the month.
Assets Under Management by Region
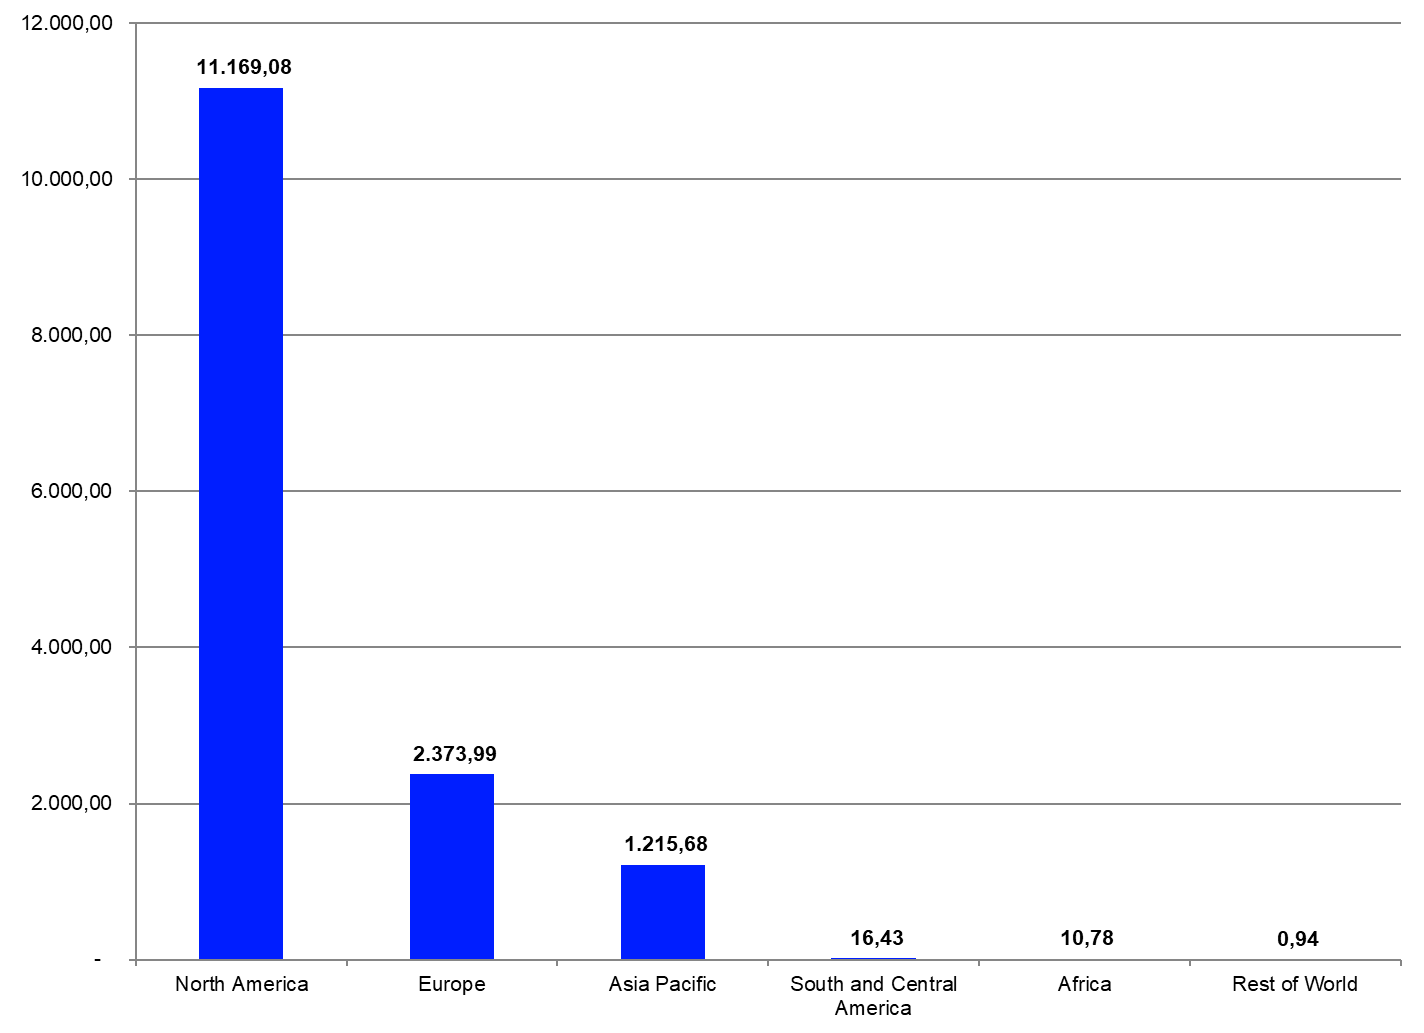
ETFs domiciled in North America ($11,169.1 bn) held the highest assets under management in the global ETF industry at the end of February 2025. They were followed by ETFs domiciled in Europe ($2,374.0 bn), ETFs domiciled in the Asia Pacific region ($1,215.7 bn), ETFs domiciled in South and Central America ($16.4 bn), ETFs domiciled in Africa ($10.8 bn), while other domiciles held ($0,9 bn) in assets under management.
Graph 8: Assets Under Management in the Global ETF Industry by Region – February 28, 2025 (in bn USD)
Source: LSEG Lipper
These numbers showcase that the global ETF industry is a truly global industry with a high concentration of the assets under management in a few domiciles.
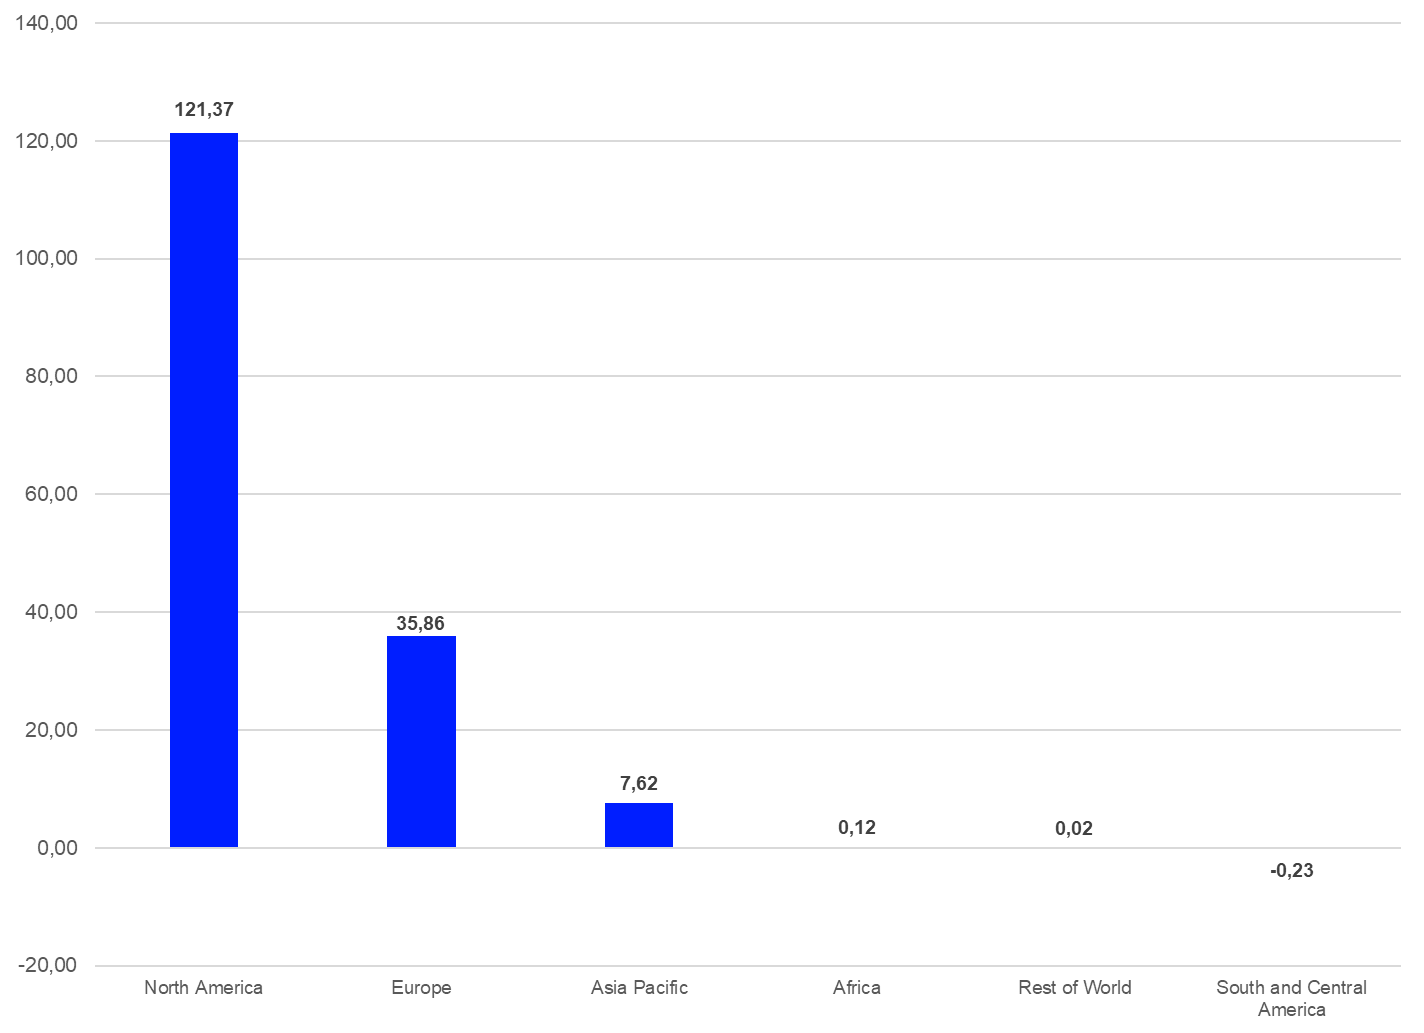
Estimated Net Flows by Region
By reviewing the estimated flows in the global ETF industry by fund domicile and the respective regions, one needs to bear in mind that some domiciles have specific advantages or disadvantages when it comes to ETF distribution. The U.S. is, for example, a single market and can take profit from the size of the overall market, while in Europe every market is or at least can be an ETF domicile, which means that the local markets are much smaller.
That said, the EU countries have established a fund regulation (Undertakings in Collective Investments and Transferable Securities, or UCITS) which enables the fund and ETF industry to cross-list all products which are registered for sale in one EU country into another EU country. Since UCITS has become such a well-recognized regulatory standard for mutual funds and ETFs, some countries in South and Central America, as well in Asia, allow UCITS funds to be cross-listed and sold to local investors. It is fair to say that there is no other regulatory framework available that allows funds to be distributed in various countries around the globe. Other mutual recognition agreements, such as those between Hong Kong and China or Hong Kong and Taiwan, are only bilateral and have no global reach. This means that the estimated flows for European ETFs in January also include flows from South and Central America, as well as from Asia.
Graph 9: Estimated Net Flows in the Global ETF Industry by Region, January 1, 2025 – January 31, 2025 (in bn USD)
Source: LSEG Lipper
As one may expect from the assets under management, ETFs domiciled in North America (+$121.4 bn) enjoyed the highest estimated net inflows for February 2025. They were followed by ETFs domiciled in Europe (+$35.9 bn), Asia Pacific (+$7.6 bn), Africa (+$0.1 bn), and other domiciles (+$0.02 bn), while ETF domiciled in South and Central America faced overall outflows (-$0.2 bn).
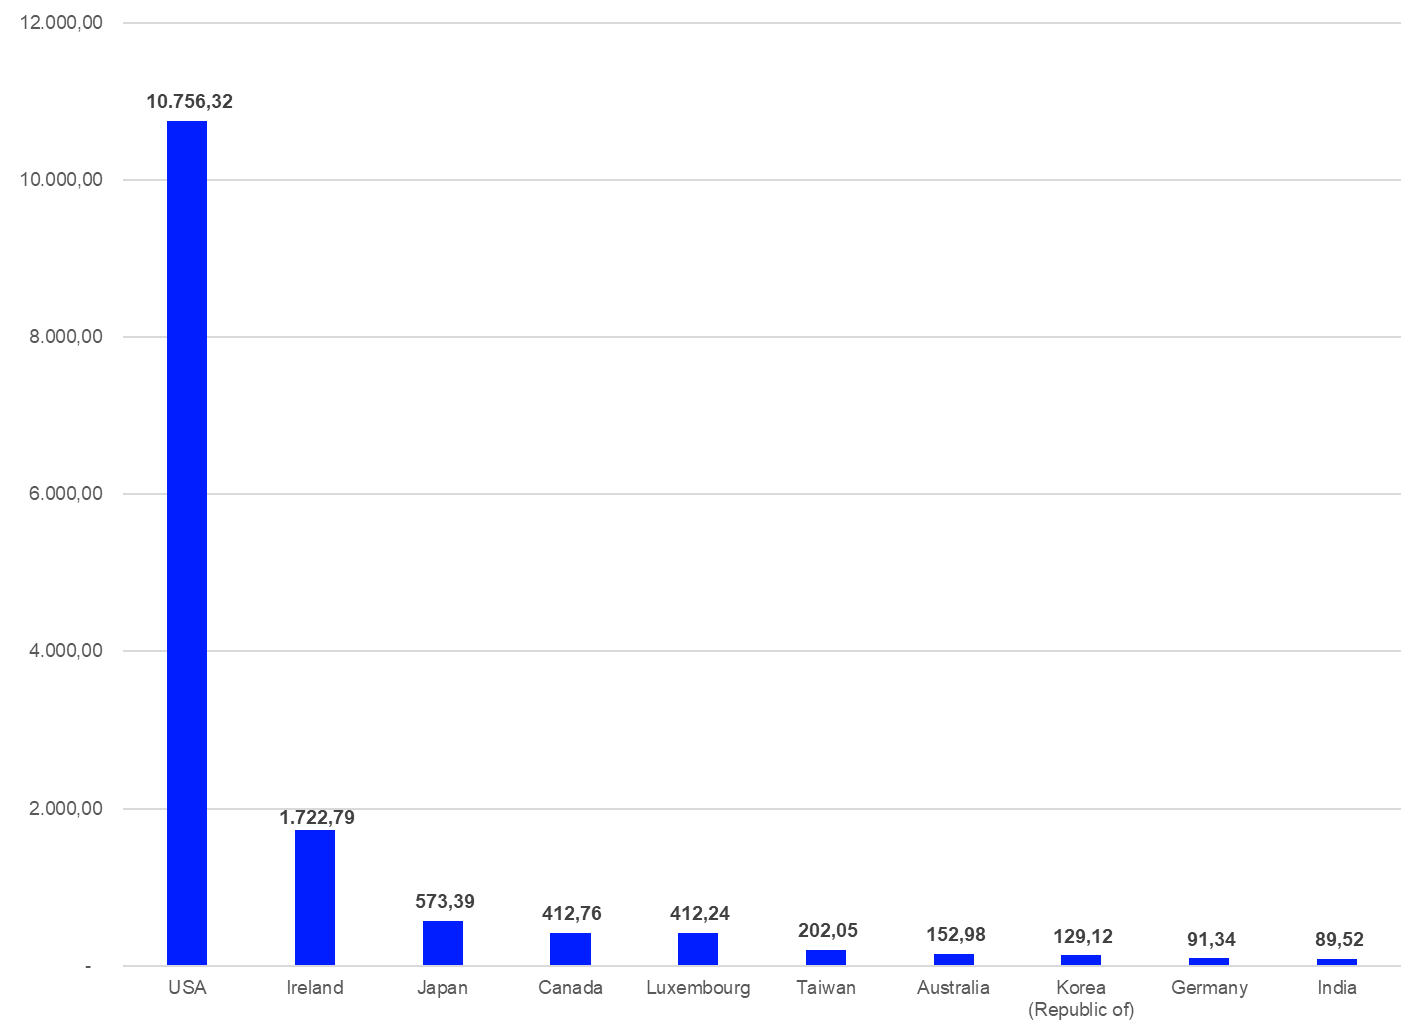
Assets Under Management by Domicile
To investigate the concentration by region further, it makes sense to analyze the assets under management by domicile. The U.S. was the largest single country ETF domicile ($10,756.3 bn) at the end of February 2025, followed by Ireland ($1,722.8 bn), Japan ($573.4 bn), Canada ($412.8 bn), and Luxembourg ($412.2 bn). These five ETF domiciles account for assets under management of $13,877.5 bn, or 93.85%, of the overall assets under management in the global ETF industry.
Graph 10: Ten Largest ETF Domiciles by Assets Under Management – February 28, 2025 (in bn USD)
Source: LSEG Lipper
These numbers show that the assets under management in the global ETF industry are dominated by a small number of domiciles. Obviously, this concentration is caused by the time period over which ETFs are available in the single domiciles, as well the overall market size of these domiciles. That said, Ireland and Luxembourg are true global ETF hubs since ETFs registered under the UCITS regulation can be sold in various markets around the world.
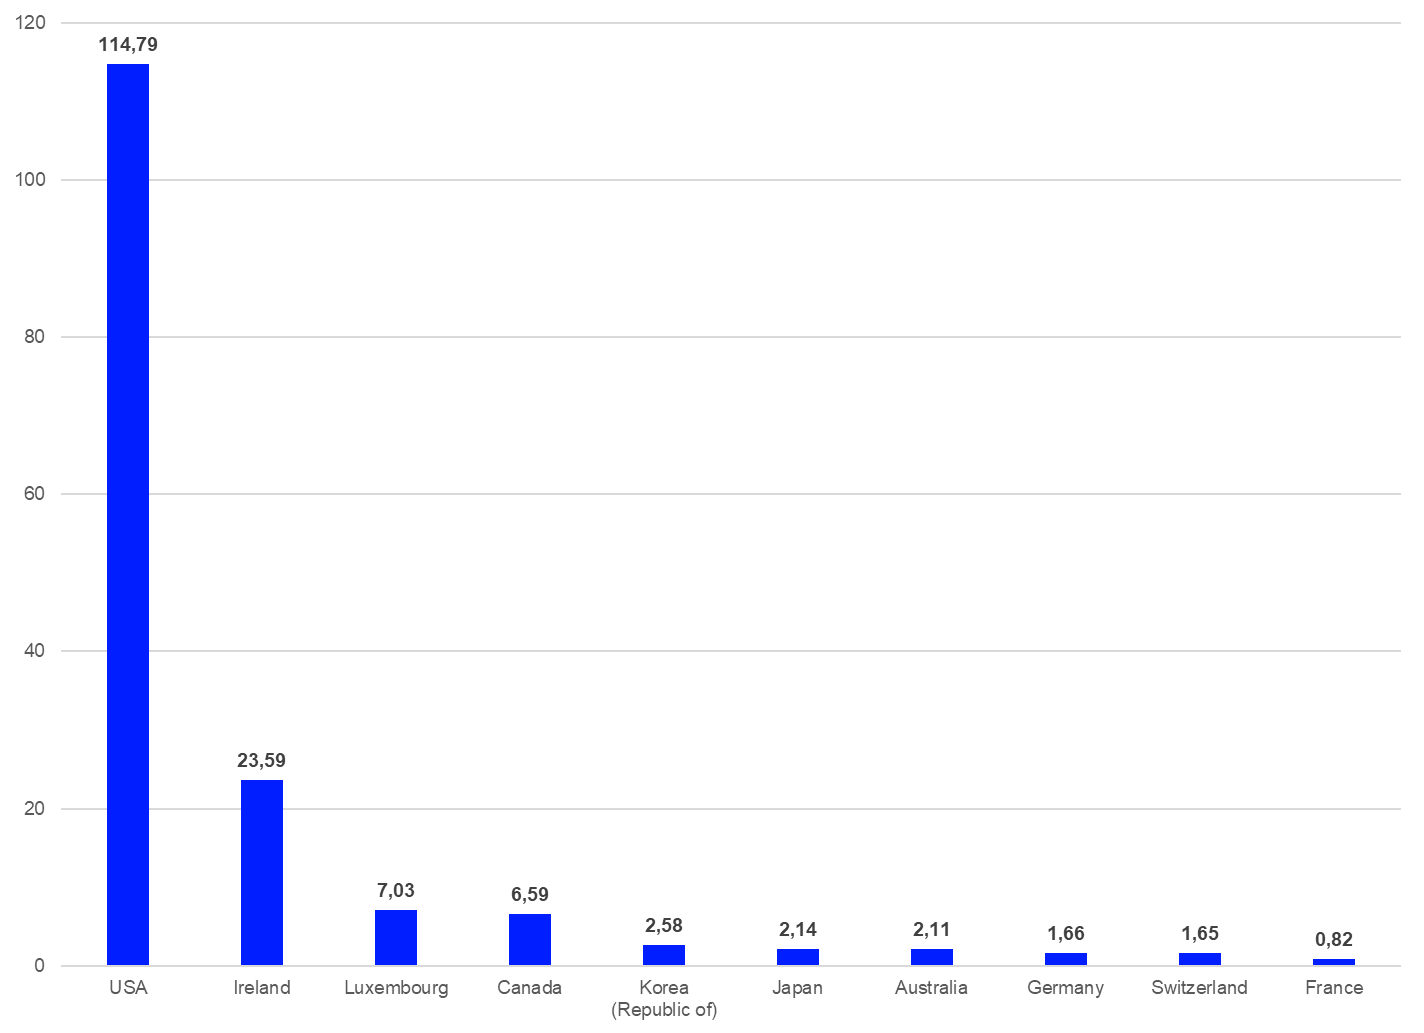
Estimated Net Flows by Domicile
In more detail, the U.S. (+$114.8 bn) was the single fund domicile with the highest estimated net inflows for February. It was followed by Ireland (+$23.6 bn), Luxembourg (+$7.0 bn), Canada (+$6.6 bn), and the Republic of Korea (+$2.6 bn).
Graph 11: The Ten ETF Domiciles with the Highest Estimated Net Inflows, January 1, 2025 – February 28, 2025 (in bn USD)
Source: LSEG Lipper
The list of the 10 best-selling domiciles does an even better job of showcasing that ETFs are truly a global phenomenon since investors around the globe are using ETFs to implement their asset allocation views into their portfolios.
This article is for information purposes only and does not constitute any investment advice.
The views expressed are the views of the author, not necessarily those of LSEG.

