February 2025 was another month with strong inflows for the U.S. ETF industry.
These inflows occurred in a volatile market environment in which investors around the globe acted nervous over any political and economic news. Investor sentiment was impacted by the discussions around tariffs by the U.S. president and potential tit-for-tat reactions from the markets which are the targets of the new tariffs. That said, the tariffs are seen as a kind of trade war between the U.S. and the rest of the world by some market observers.
When it comes to this, investors were concerned about a political shift to the right as a result of the general election in Germany in February. Since, these concerns did not materialize, German equities started a relief rally, as a possible great coalition seem to be in favor of the investors.
Meanwhile, central banks around the globe adjusted their policies to the current environment by cutting interest rates. These decisions reflect central banks’ efforts to navigate economic challenges, including trade tensions, inflationary trends, and the high market volatility, to support their local economies.
Nevertheless, fears of increasing debt in the U.S. and other major economies might be the driver for the “relatively low” estimated net inflows into bond ETFs, while the still somewhat inverted yield curves might be the drivers for the inflows into money market ETFs.
That said, inverted yield curves and especially long-term inverted yield curves are seen as an early indicator for a possible recession. However, there is only a very limited number of indicators which are sending negative signals for economic growth in the U.S. and other major economies. With regard to this, it is noteworthy that most of these negative indicators get offset by positive signals from other indicators. But even as it looks like the yield curves are slowly normalizing, this does not mean that there is no recession possible in the major economies around the globe. This is especially true since some major economies, such as Germany, lack economic growth and may need lower interest rates as stimulus. Despite these headwinds, the positive effects of lower interest rates seem to be more important for investors than the current state of some economies.
From an ETF industry perspective, the performance of the underlying markets led, in combination with the estimated net flows, to decreasing assets under management (from $10,757.8 bn as of January 31, 2025, to $10,757.0 bn at the end of February). At a closer look, the decrease in assets under management of $824.7 bn for February was driven by performance of the underlying markets ($-115.6 bn), while estimated net inflows contributed (+$114.8 bn), to the assets under management.
Assets Under Management by Asset Type
As for the overall structure of the U.S. ETF industry, it was not surprising equity ETFs ($8,506.4 bn) held the majority of assets, followed by bond ETFs ($1,901.7 bn), commodities ETFs ($179.8 bn), alternatives ETFs ($140.7 bn), mixed-assets ETFs ($28.4 bn), and money market ETFs ($0.1 bn).
Despite the current market environment, it is no surprise that the assets under management for equity, bond, commodities, mixed assets, and money market ETFs marked an all-time high at the end of the month. This is because the main headwinds for the assets under management are witnessed in the equity markets.
Graph 1: Market Share, Assets Under Management in the U.S. ETF Industry by Asset Type, February 28, 2025
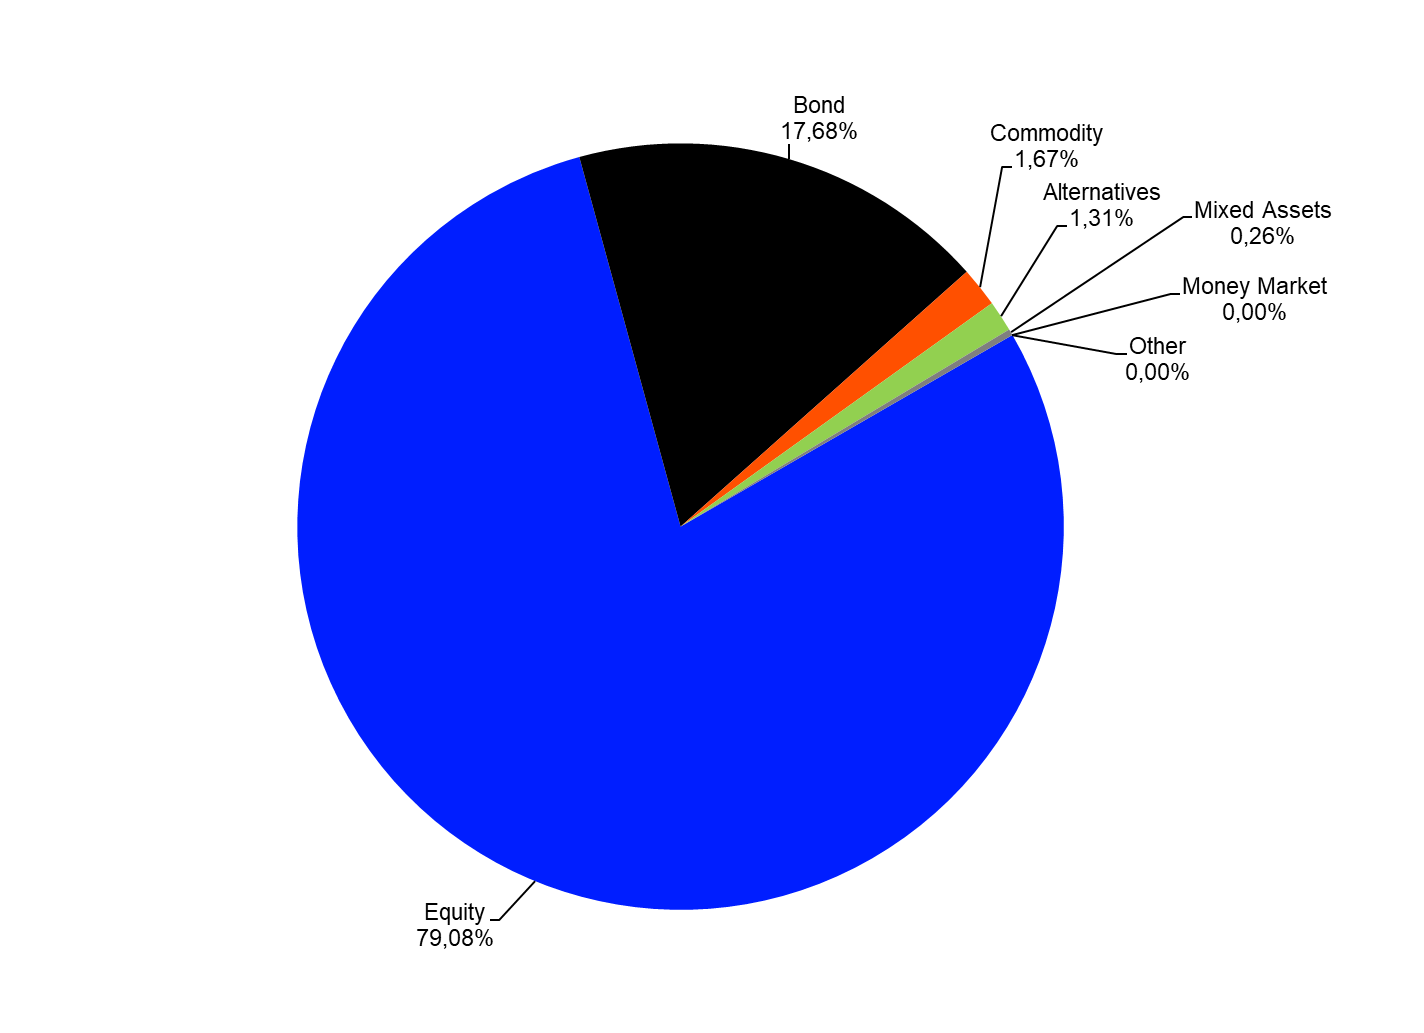
Source: LSEG Lipper
ETF Flows by Asset Type
The U.S. ETF industry enjoyed strong estimated net inflows (+$114.8 bn) over the course of February despite the headwinds in the equity markets. These inflows drove the overall inflows in ETFs up to $219.5 bn for the year 2025 so far.
The inflows in the U.S. ETF industry for February were driven by equity ETFs (+$67.0 bn), followed by bond ETFs (+$41.1 bn), commodities ETFs (+$6.8 bn), and mixed-assets ETFs (+$1.2 bn), while alternatives (-$1.3 bn) faced outflows.
Graph 2: Estimated Net Sales by Asset Type, February 2025 (USD Billions)
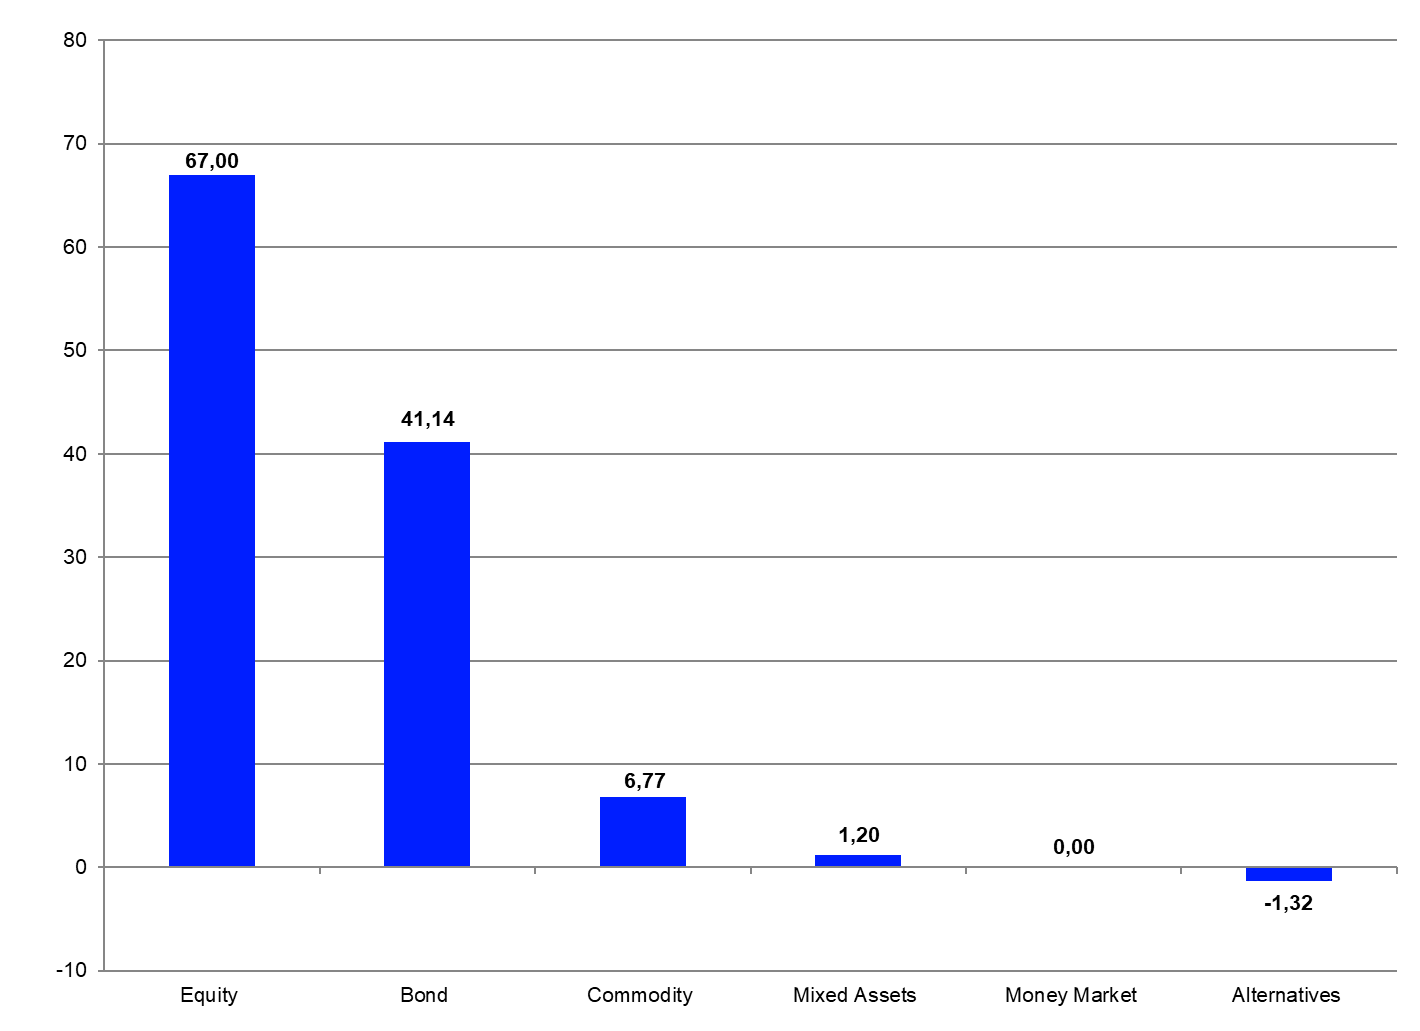
Source: LSEG Lipper
Assets Under Management by Lipper Global Classifications
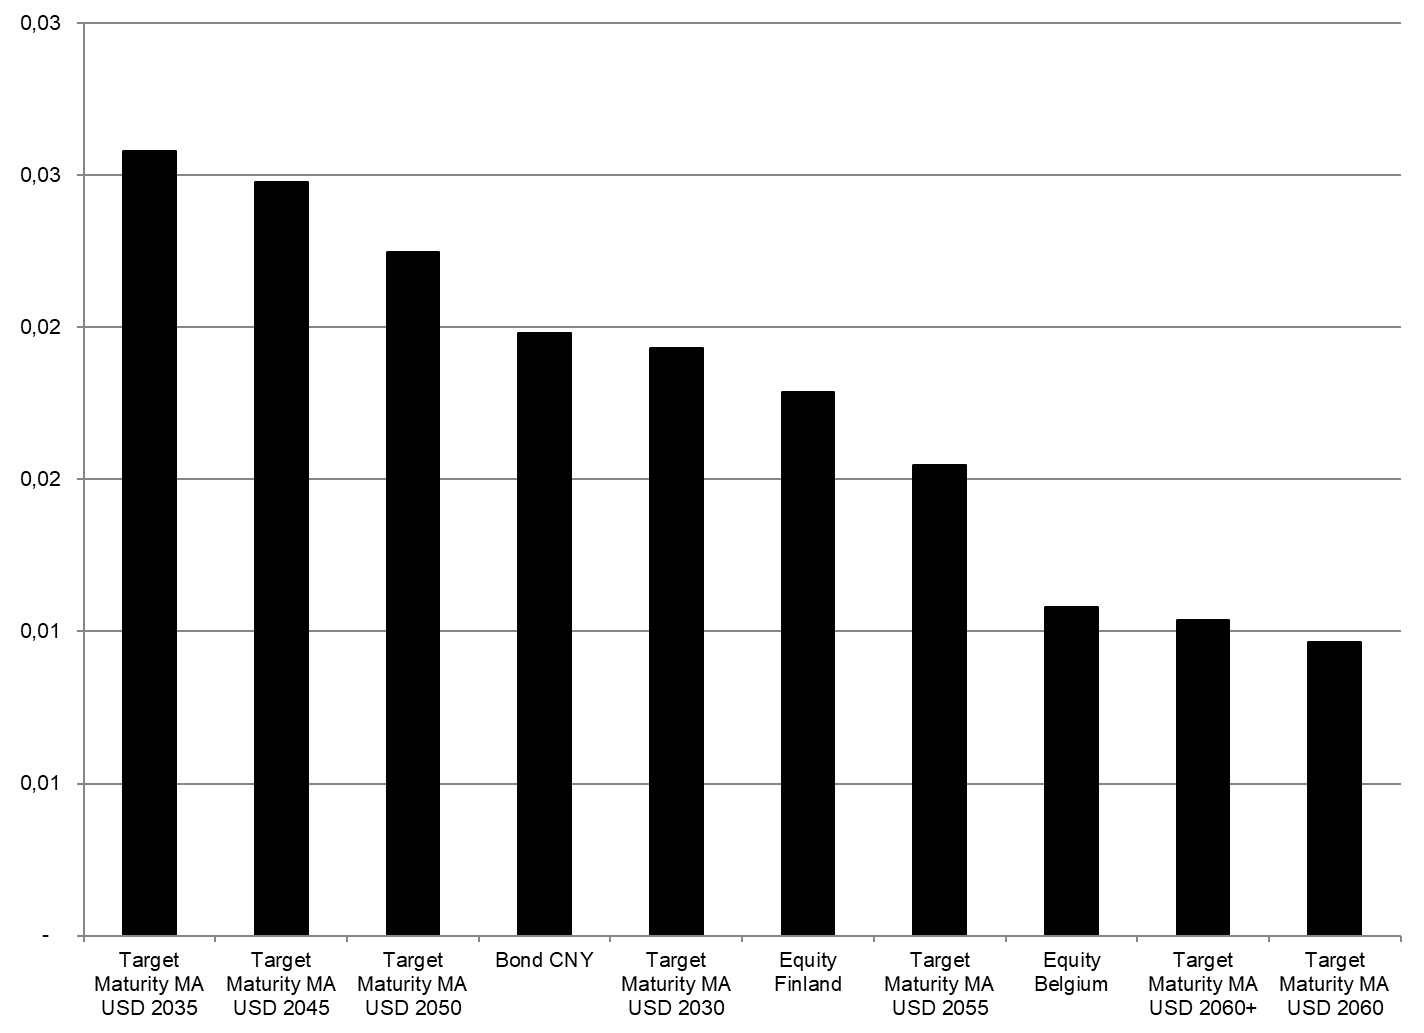
In order to examine the U.S. ETF markets in further detail, a review of the Lipper global classifications will lead to more insights on the structure and concentration of assets within the U.S. ETF industry. At the end of February 2025, the U.S. ETF market was split into 139 different peer groups. The highest assets under management at the end of February were held by funds classified as Equity U.S. ($4,602.5 bn), followed by Equity U.S. Small & Mid Cap ($875.0 bn), Equity Global ex U.S. ($770.0 bn), Bond USD Medium Term ($489.3 bn), and Equity U.S. Income ($409.4 bn). These five peer groups accounted for 66.43% of the overall assets under management in the U.S. ETF segment, while the 10-top classifications by assets under management accounted for 77.57%.
Overall, 15 of the 139 peer groups each accounted for more than 1% of assets under management. In total, these 15 peer groups accounted for $9,039.1 bn, or 84.03%, of the overall assets under management.
Graph 3: Ten Largest Lipper Global Classifications by Assets Under Management, February 28, 2025 (USD Billions)

Source: LSEG Lipper
The peer groups on the other side of the table showed some funds in the U.S. ETF market are quite low in assets and their constituents may face the risk of being closed in the near future. They are obviously lacking investor interest and might, therefore, not be profitable for their respective fund promoters.
Graph 4: Ten Smallest Lipper Global Classifications by Assets Under Management, February 28, 2025 (USD Billions)
Source: LSEG Lipper
ETF Flows by Lipper Global Classifications
The net inflows of the 10 best-selling Lipper classifications accounted for $106.5 bn. In line with the overall sales trend for February, equity peer groups (+$63.6 bn) gathered the majority of flows by asset type on the table of the 10 best-selling classifications by estimated net inflows for February 2025. Given the overall fund flow trend in the U.S. ETF industry, it was not surprising that Equity U.S. (+$52.7 bn) was the best-selling Lipper global classification for February. It was followed by Bond USD Medium Term (+$9.1 bn) and Bond USD Government Short Term (+$9.1 bn).
Since money market is in general not considered a core asset type within the U.S. ETF industry, it is not surprising that there were no money market products on the table for the best-selling classifications in the U.S. ETF industry.
More generally, these numbers showed the U.S. ETF segment is also highly concentrated when it comes to the estimated net flows by classification. Generally speaking, one would expect the flows into ETFs to be concentrated since investors often use ETFs to implement their market views and short-term asset allocation decisions. These products are made and, therefore, are easy to use for these purposes.
Graph 5: Ten Best- and Worst-Lipper Global Classifications by Estimated Net Sales, February 2025 (USD Billions)
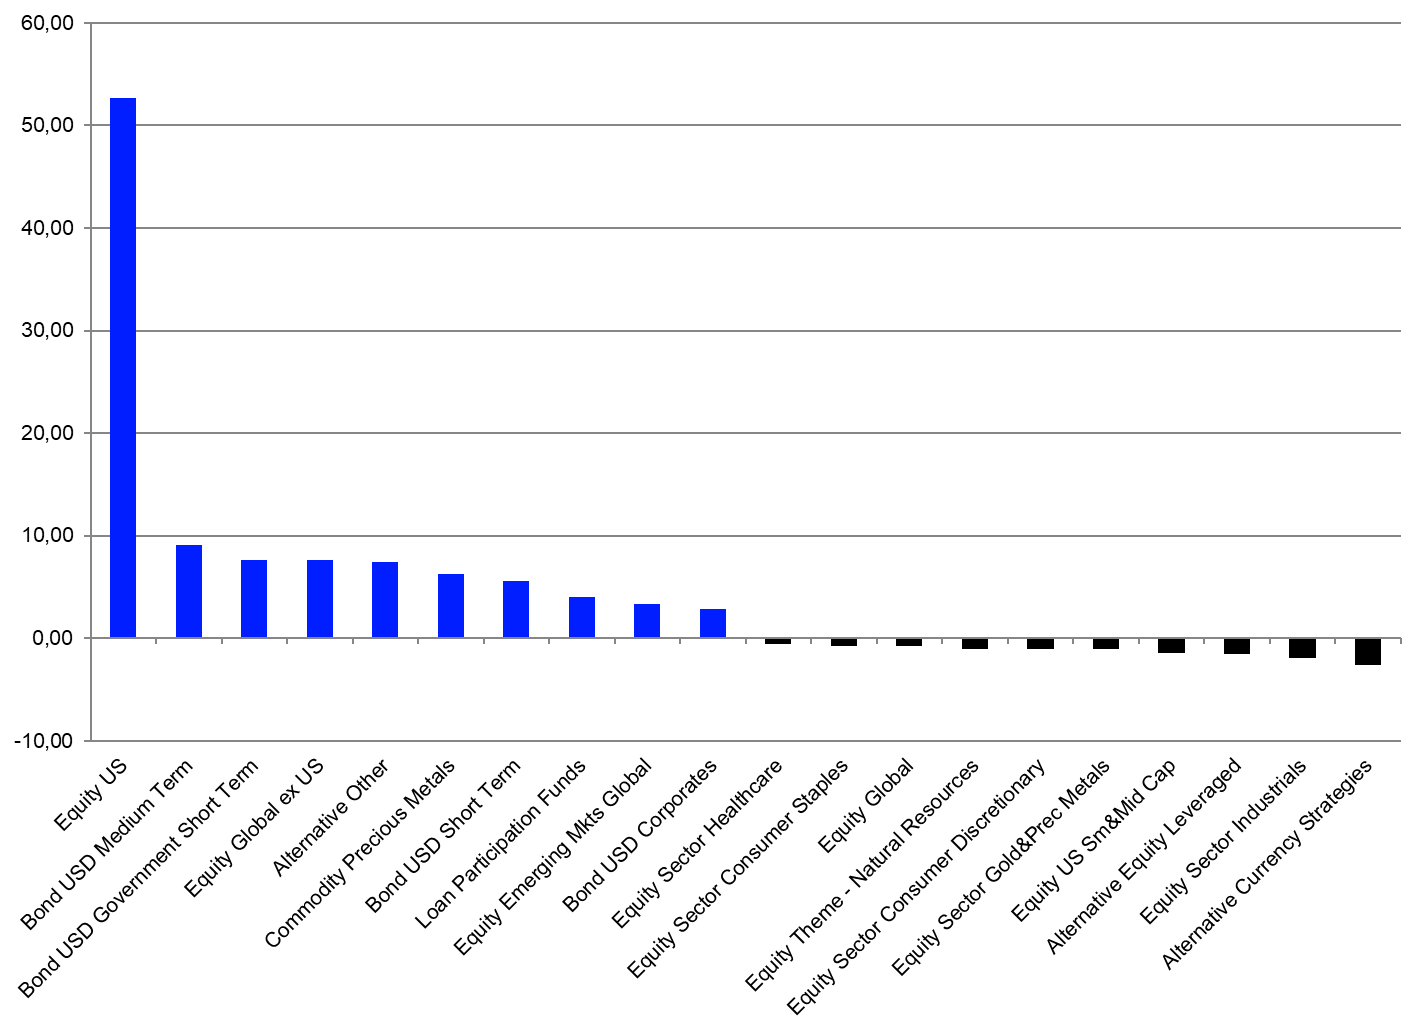
Source: LSEG Lipper
On the other side of the table, the 10 peer groups with the highest estimated net outflows for February accounted for $12.9 bn in outflows.
Alternative Currency Strategies (-$2.7 bn) was the classification with the highest outflows for the month. It was bettered by Equity Sector Industrials (-$2.0 bn), Alternative Equity Leveraged (-$1.5 bn), Equity U.S. Small & Mid Cap (-$1.5 bn), and Equity Sector Gold & Precious Metals (-$1.1 bn).
Assets Under Management by Promoters
A closer look at assets under management by promoters in the U.S. ETF industry also showed high concentration, with only 96 of the 380 ETF promoters in the U.S. ETF industry holding assets at or above $1.0 bn. The largest ETF promoter in the U.S.—iShares ($3,254.2 bn)—accounted for 30.25% of the overall assets under management, ahead of the number-two promoter—Vanguard ($3,105.9 bn)—and the number-three promoter—SPDR ($1,551.2 bn).
Graph 6: The 10 Largest ETF Promoters by Assets Under Management, February 28, 2025 (USD Billions)
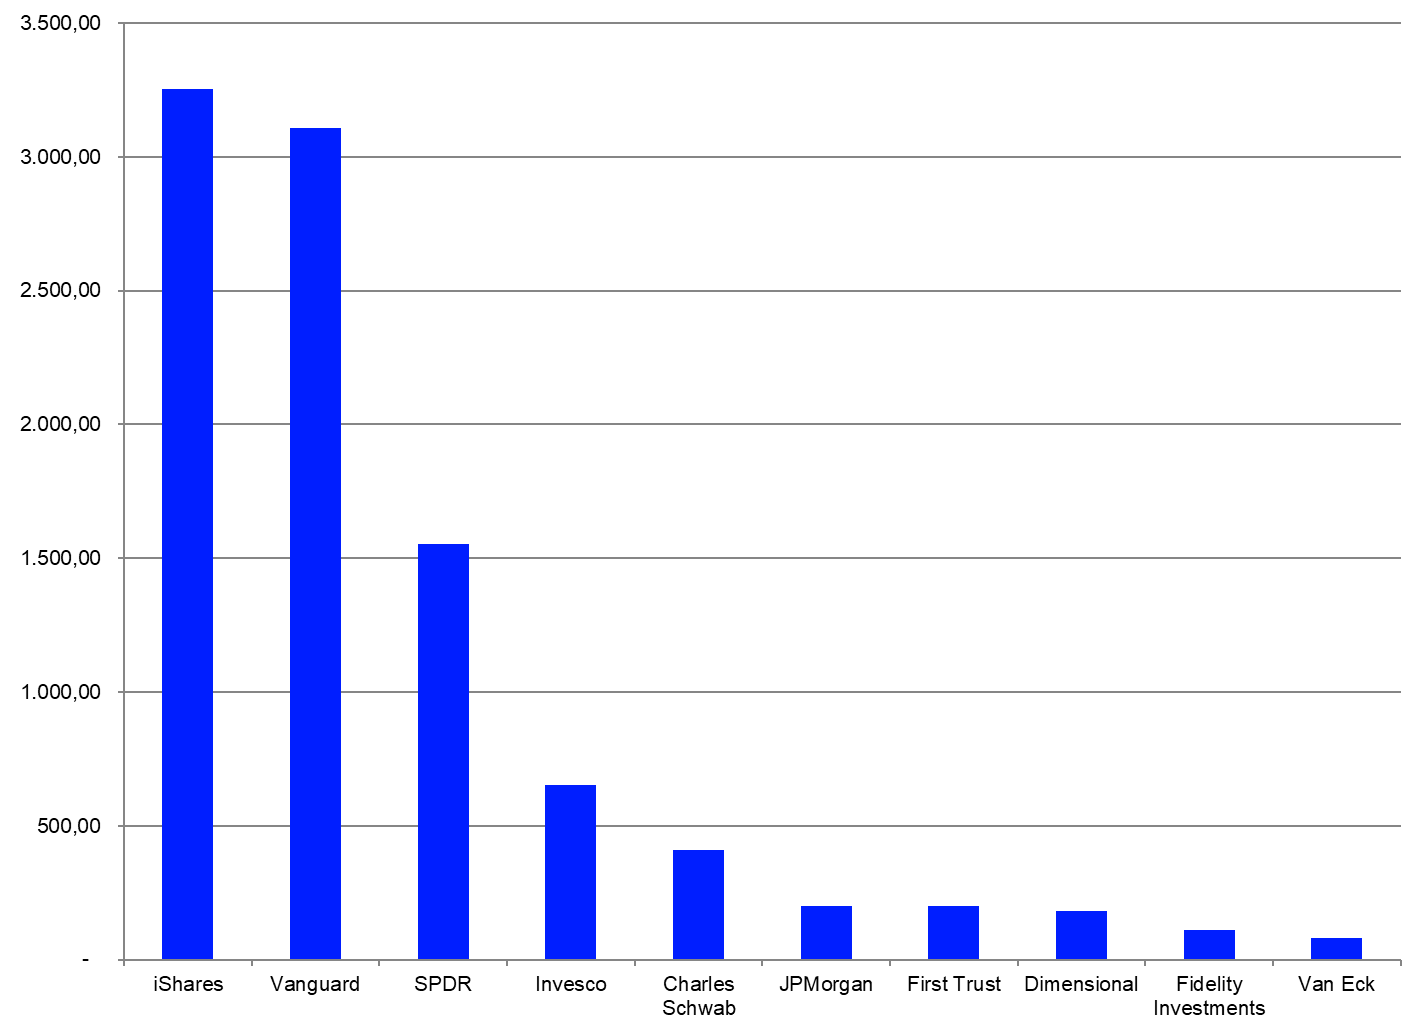
Source: LSEG Lipper
The 10-top promoters accounted for 90.63% of the overall assets under management in the U.S. ETF industry. This meant, in turn, the other 370 fund promoters registering at least one ETF for sale in Europe accounted for only 9.37% of the overall assets under management.
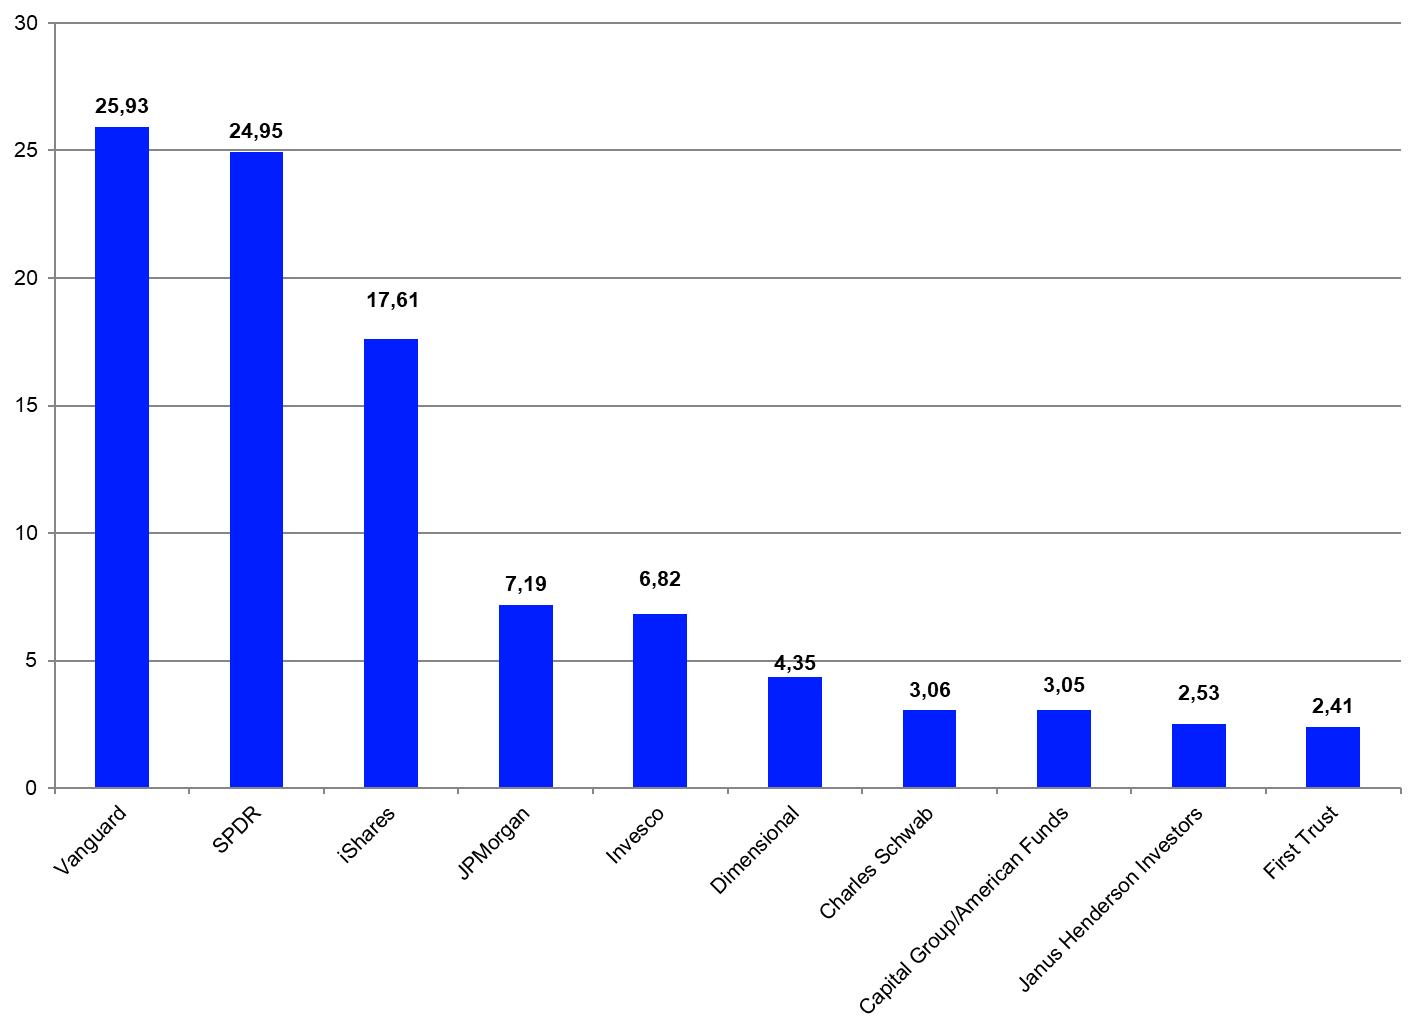
ETF Flows by Promoters
Since the U.S. ETF market is highly concentrated with regard to the assets under management by promoter, it was not surprising that eight of the 10 largest promoters by assets under management were among the 10-top selling ETF promoters for February. Vanguard was the best-selling ETF promoter in the U.S. for February (+$25.9 bn), ahead of SPDR (+$25.0 bn) and iShares (+$17.6 bn).
Graph 7: Ten Best-Selling ETF Promoters, February 2025 (USD Billions)
Source: LSEG Lipper
The flows of the 10-top promoters accounted for estimated net inflows of $97.9 bn. As for the overall flow trend in February, it was clear that some of the 380 promoters (79) faced estimated net outflows (-$5.8 bn in total) over the course of the month.
Assets Under Management by ETFs
There were 4,095 instruments (primary share classes [4,026] and convenience share classes [69]) listed as ETFs in the Lipper database at the end of February. Regarding the overall market pattern, it was not surprising assets under management at the ETF level were also highly concentrated. Only 761 of the 4,026 ETFs (primary share classes = portfolios) held assets above $1.0 bn each. These ETFs accounted for $10,229.6 bn, or 95.10%, of the overall assets in the U.S. ETF industry. The 10 largest ETFs in the U.S. accounted for $3,332.4 bn, or 30.98%, of the overall assets under management.
Graph 8: The 10 Largest ETFs by Assets Under Management, February 28, 2025 (USD Billions)

Source: LSEG Lipper
Estimated Net Flows at the ETF Level
A total of 1,977 of the 4,026 ETFs (primary share classes = portfolios) analyzed in this report showed net inflows of more than $10,000 each for February, accounting for inflows of $166.9 bn. This meant the other 2,049 instruments faced no flows, or net outflows, for the month. Upon closer inspection, 962 of the 1,977 ETFs posting net inflows enjoyed inflows of more than $100 m during February—for a total of $163.6 bn. The best-selling ETF for February was SPDR S&P 500 ETF Trust, which enjoyed estimated net inflows of $14.6 bn. It was followed by Vanguard 500 Index Fund;ETF (+$8.4 bn) and Invesco QQQ Trust, Series 1 (+$4.4 bn).
Graph 9: The 10 Best-Selling ETFs, February 2025 (USD Billions)

Source: LSEG Lipper
The flow pattern at the fund level indicated there was a lot of turnover and rotation during February, but it also showed the concentration of the U.S. ETF industry even better than the statistics at the promoter or classification levels since the 10 best-selling ETFs account for inflows of $45.1 bn.
Given its size and the overall trend for net sales at the promoter level, it was surprising that only four of the 10 best-selling funds for February were promoted by iShares. These iShares ETFs accounted for estimated net inflows of $10.1 bn.
This article is for information purposes only and does not constitute any investment advice.
The views expressed are the views of the author, not necessarily those of Lipper or LSEG.

