Click here to view the dashboard in detail.
Please note: Updated to include companies that reported after market close.
Earnings
- Q3 201616
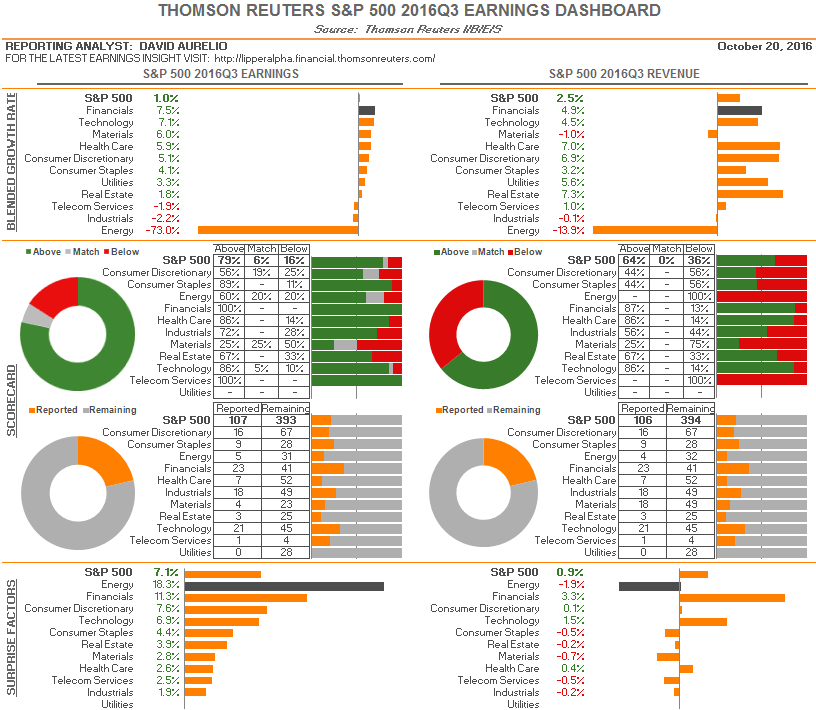
- The Q3 2016 blended earnings growth estimate is 1.0%. Excluding the energy sector, the earnings growth estimate for the index improves to 4.8%.
- 21% of the S&P 500 companies have reported Q3 2016 EPS. Of the 107 companies in the S&P 500 that have reported earnings to date for Q3 2016, 78.5% have reported earnings above analyst expectations, 5.6% reported earnings in line with analyst expectations and 15.9% reported earnings below analyst expectations. In a typical quarter (since 1994), 64% of companies beat estimates, 16% match and 21% miss estimates. Over the past four quarters, 70% of companies beat estimates, 9% matched and 21% missed estimates.
- In the S&P 500, there have been 83 negative EPS preannouncements issued by corporations for Q3 2016 compared to 36 positive EPS preannouncements. By dividing 83 by 36 one arrives at an N/P ratio of 2.3 for the S&P 500 Index. This is below the long term average (since 1997) of 2.7 and below the trailing four quarter average of 3.1.
- Q4 2016
- The Q4 2016 blended earnings growth estimate is 8.1%. Excluding the energy sector, the earnings growth estimate for the index increases to 8.3%.
Revenue
- Q3 2016
- The Q3 2016 blended revenue growth estimate is 2.5%. Excluding the energy sector, the revenue growth estimate for the index increases to 4.3%.
- 64% have reported Q3 2016 revenue above analyst expectations, 0% reported earnings in line with analyst expectations and 36% reported earnings below analyst expectations. In a typical quarter (since 2002), 59.5% of companies beat estimates and 40.5% miss estimates. Over the past four quarters, 49% of companies beat estimates and 51% missed estimates.
- In the S&P 500, there have been 51 negative revenue preannouncements issued by corporations for Q3 2016 compared to 45 positive EPS preannouncements. By dividing 51 by 45 one arrives at an N/P ratio of 1.1 for the S&P 500 Index. This is below the long term average (since 2008) of 1.8 and below the trailing four quarter average of 1.5.
- Q4 2016
- The Q4 2016 blended revenue growth estimate is 5.3%. Excluding the energy sector, the revenue growth estimate for the index increases to 5.0%.
Please note: if you use our earnings data, please source Thomson Reuters I/B/E/S
S&P 500 Earnings today report provides the aggregate earnings performance relative to estimates and growth rates. Access the full S&P 500 Earnings Scorecard report archives here.
Thomson Reuters Eikon, a complete solution for research and analytics. It places the most comprehensive market information, news, analytics and trading tools available into a desktop as simple to use as the Internet. Thomson Reuters Eikon clients can run fundamental and technical screens against a global dataset representing more than 100 countries and over 200,000 securities.