Chart of the Week: The ‘Fed model’ and equity prices: market tremors ahead?
Most agree on a positive association between the equity earnings yield and the bond yield for two reasons. First, equities and bonds are competing for investor capital. Hence, when the bond yield increases, the equity price should fall so that the earnings yield increases to preserve the competitiveness of equities. Second, the equity price is the sum of its discounted present value future cash flows. Therefore, when interest rates fall, present values rise to decrease the equity earnings yield.
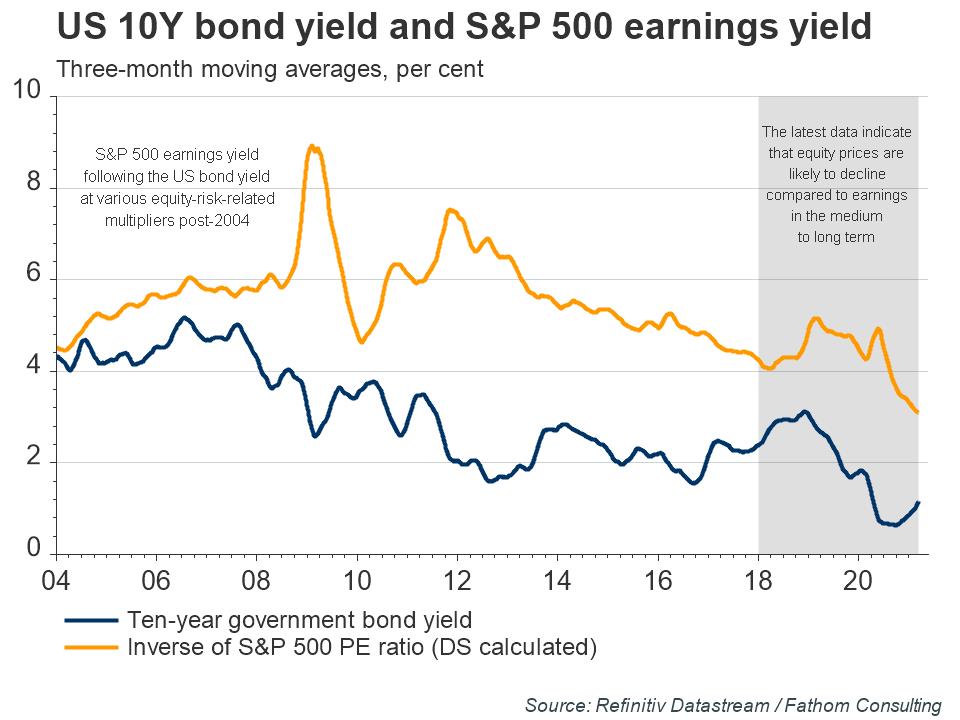
These mechanisms are encapsulated by the ‘Fed model’, which states that, in equilibrium, equity earnings yield should be equal to the long-term bond yield (or, less restrictively, equal times a multiplier reflecting equities’ higher riskiness). Data supports this rationale from the 1960s, also pointing to a lead-lag relationship between the bond yield and the equity earnings yield. The chart shows the S&P 500 earnings yield following the US bond yield at various equity-risk-related multipliers post-2004. The model’s pricing implications are therefore important for policymakers in gauging the effect of changes in monetary policy on yields. They are also important for investors in making optimal capital allocations.
Through the lens of the Fed model, latest data (since 2018) indicate that equity prices are likely to decline compared to earnings in the medium to long term. The bond yield is rising due to stronger macro cyclical conditions and, to a lesser extent, in anticipation of monetary tightening with higher interest rates (since the inflation risk is still low). The earnings yield is currently falling due to collapsed earnings and recovering prices. As the bond yield may start creeping higher due to a stronger inflation risk, equity prices could recede against earnings and the market could panic. When, by how much and for how long partly depends on the timing of any Fed interventions.
Refresh this chart in your browser | Edit the chart in Datastream
Join a growing community of asset managers and stay up to date with the latest research from Refinitiv and partners to help you inform your investment decisions. Follow our Asset Management LinkedIn showcase page.
________________________________________________________________________________________
Financial time series database which allows you to identify and examine trends, generate and test ideas and develop view points on the market.
Refinitiv offers the world’s most comprehensive historical database for numerical macroeconomic and cross-asset financial data which started in the 1950s and has grown into an indispensable resource for financial professionals. Find out more.

LSEG Solutions
Related Articles
Consumer Confidence Declines As Expectations and Jobs Indices Continue to Fall
WASHINGTON, DC - The LSEG/Ipsos Primary Consumer Sentiment Index for April 2025 is ...
News in Charts: A busy week for economists
It has been a busy week for economists, especially for those engaged in financial ...
Chart of the Week: US assets showed signs of overpricing before sell-off
The markets sell-off since President Trump’s ‘Liberation Day’ tariff announcements ...
News in Charts: The rise of the Chinese automotive industry
A remarkable transformation has taken place in the global automotive export market in the ...
