European earnings and revenue growth continue to be resilient in 22Q2 in the face of recession worries, higher inflation and interest rates and concerns around energy security.
22Q2 earnings growth is currently 31.6% y/y (19.9% q/q). Year-over-year growth has increased by 12.4 percentage points (ppt) since the start of earnings season (31.6% vs. 19.2%). Excluding energy, earnings growth is 11.2% y/y.
Exhibit 1 displays 22Q2 earnings growth in terms of earnings contribution where we see most of the earnings growth coming from the Energy sector (21.6 percentage points towards the index growth rate of 31.6%). In other words, Energy is contributing approximately 70% of the total index growth this quarter. Basic Materials (3.2 ppt), Industrials (3.1 ppt) are the next largest contributors while Financials (-0.8 ppt), and Real Estate (-1.7 ppt) were a drag to the index.
Exhibit 1: STOXX 600 Earnings Contribution

Approximately 229 constituents have reported earnings of which 62.4% have reported results above analyst expectations and in-line with the prior four-quarter average of 63.4% and above the long-term average of 52.5%.
Utilities (80.0%), Consumer Non-Cyclicals (75.0%), and Industrials (69.8%) have the highest earnings beat rate while Real Estate (40.0%), Technology (53.1%), and Health Care (58.3%) have the lowest beat rate.
The aggregate earnings surprise factor (actual vs. mean estimate on day of reporting) of 9.5% is also above the long-term average of 5.9%. Approximately 53% of constituents who have reported beat estimates by more than 5%. Conversely, 24% of constituents missed estimates by more than 5%.
Moving to revenue, 22Q2 revenue growth is currently 26.5% y/y (6.7% q/q). Year-over-year growth has increased by 5.2 ppt since the start of earnings season (26.5% vs. 21.3%). Excluding energy, revenue growth is 14.9% y/y.
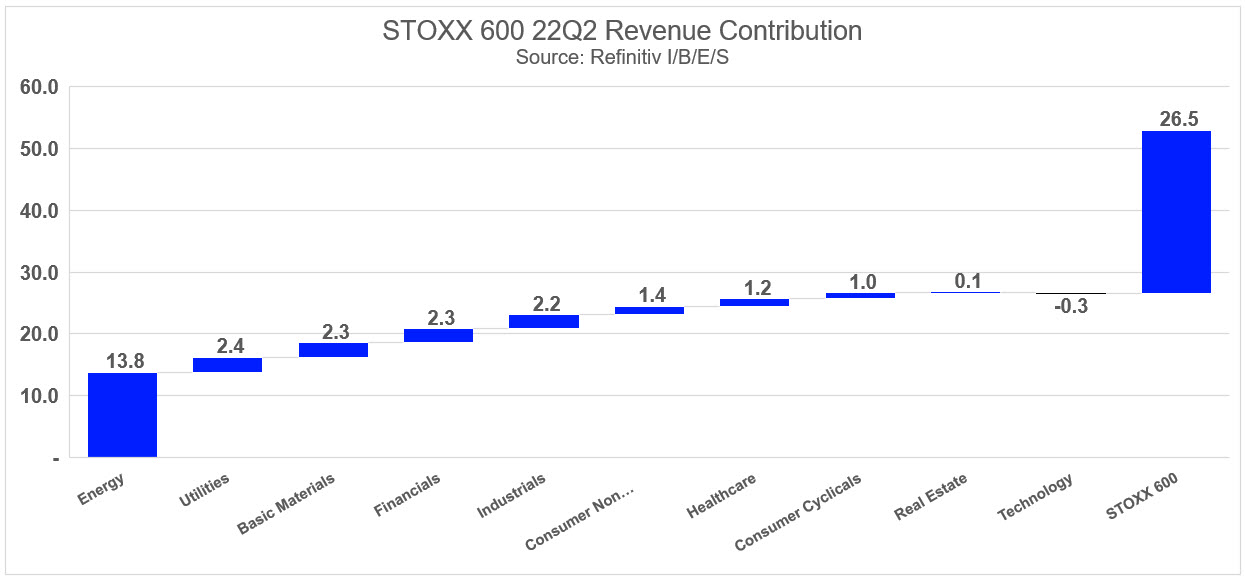
Exhibit 2 displays 22Q2 revenue growth in terms of revenue contribution where we see most of the earnings growth coming from the Energy sector (13.8 percentage points towards the index growth rate of 26.5%). In other words, Energy is contributing approximately 52% of the total index growth this quarter. Utilities (2.4 ppt), Basic Materials (2.3 ppt) are the next largest contributors while Technology (-0.3 ppt) was a slight drag to the index.
Exhibit 2: STOXX 600 Revenue Contribution
Approximately 74.2% of constituents have reported revenue results above analyst expectations and is above the prior four-quarter average of 72.1% and above the long-term average of 57.3%.
Utilities (100.0%), Consumer Non-Cyclicals (92.9%), and Financials (79.2%) have the highest revenue beat rate while Health Care (61.5%), Real Estate (63.6%), and Consumer Cyclicals (65.2%) have the lowest beat rate.
The aggregate revenue surprise factor (actual vs. mean estimate on day of reporting) of 4.1% is also above the long-term average of 0.8%. Approximately 57% of constituents who have reported beat estimates by more than 2%. Conversely, 13% of constituents missed estimates by more than 2%.
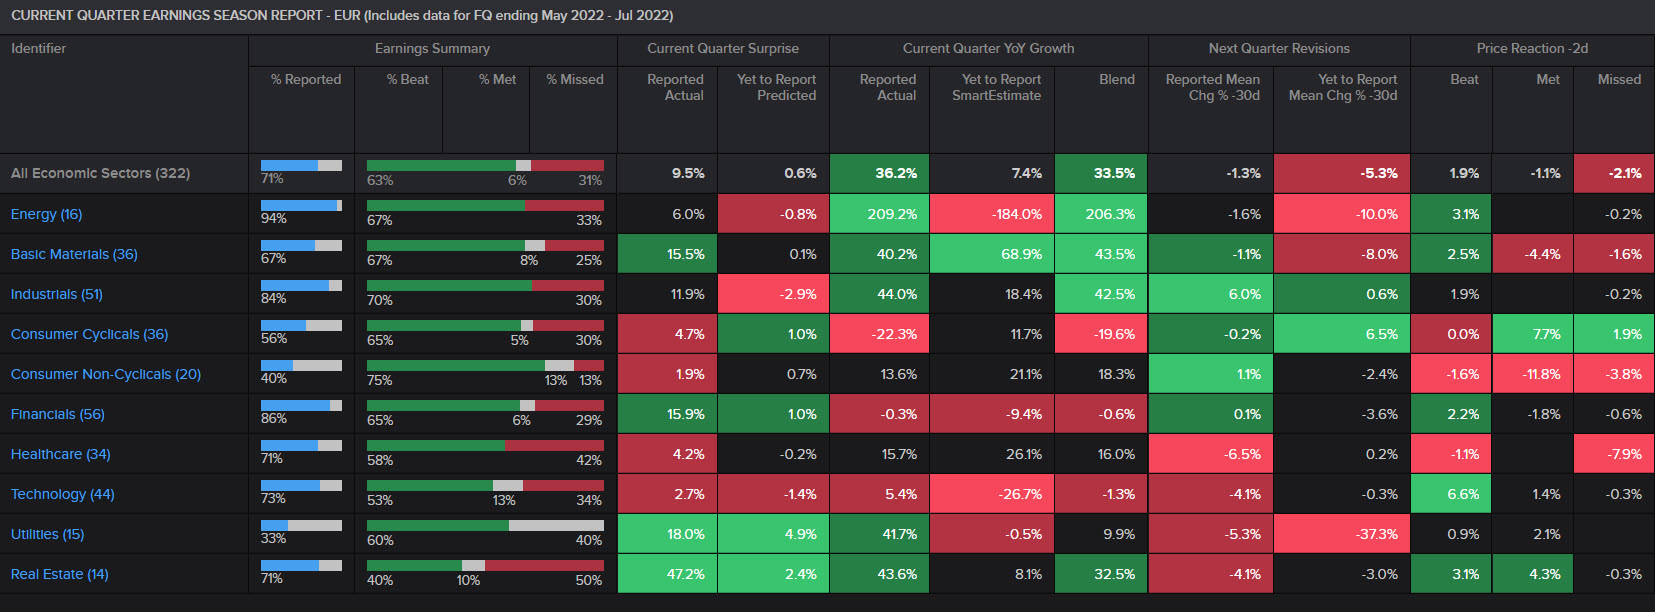
Using the Earnings Season app in Refinitiv Workspace (Exhibit 3), we note that companies who missed earnings expectations saw an average two-day price decline of 2.1% vs. a 1.9% increase for companies who beat expectations. Interestingly, companies who met analyst expectations saw an average price decline of 1.1%.
Exhibit 3: STOXX 600 Earnings Season App
Source: Refinitiv Workspace
Quarterly and Full-Year Earnings Revision
In Exhibit 3, the ‘Next Quarter Revisions’ column provides insight to how analysts react post-results. For constituents that have reported thus far (Reported Mean Chg % 30d sub-column), this group has seen analysts downgrade next quarter earnings estimates by 1.3% over the last 30 days. Health Care (-6.5%), Utilities (-5.3%), and Real Estate (-4.1%) is showing the largest downward revisions while Industrials (6.0%) has the largest upward revision.
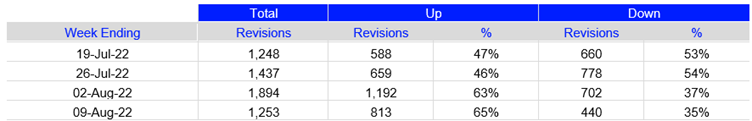
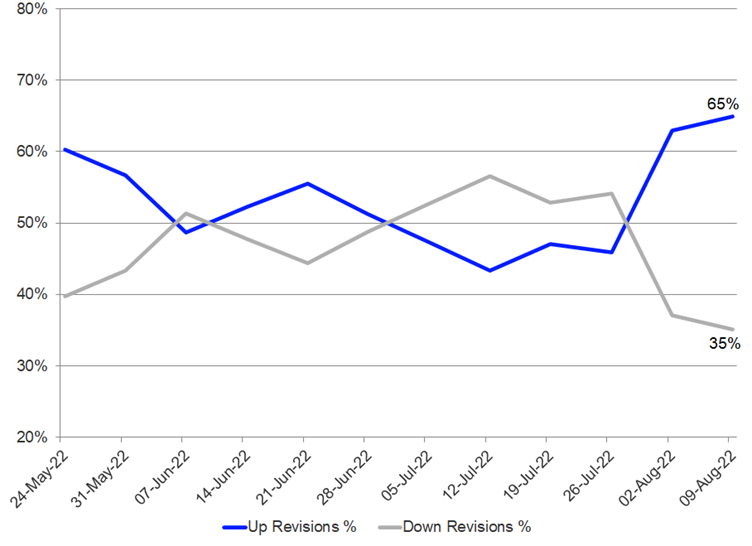
Our weekly STOXX 600 Earnings Outlook report also highlights earnings revision for full-year estimates (FY1) which highlights a noteworthy signal vs. the quarterly revisions above. Analysts have instead been raising FY1 estimates aggressively during the last two weeks (Exhibit 4). The latest weekly reading shows an upwards ratio of 64.9% which is the highest weekly reading since November 2021.
Exhibit 4: STOXX 600 Earnings Estimate Revision Trend
Source: STOXX 600 Earnings Outlook
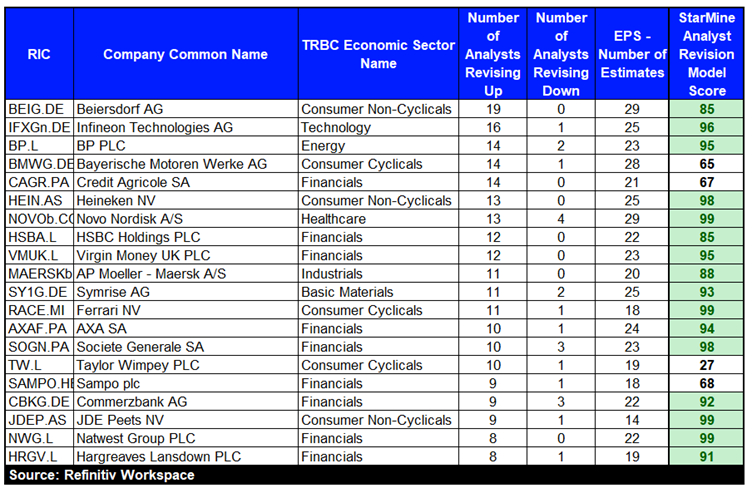
Exhibit 5 highlights a list of 20 constituents with the highest number of FY1 EPS analyst estimate increases for the week ending August 9th. Beiersdorf AG (BEIG.DE) saw the highest number of upgrades, followed by Infineon Technologies AG (IFXGn.DE), BP PLC (BP.L), Bayerische Motoren Werke AG (BMWG.DE), and Credit Agricole SA (CAGR.PA).
We also overlay each constituent’s StarMine Analyst Revision Model (ARM) rank. ARM is a stock ranking model that is designed to predict future changes in analyst sentiment by looking at changes in estimates across EPS, EBITDA, Revenue, and Recommendations over multiple time periods.
We observe a strong correlation between a constituent’s ARM rank and the number of upward estimate revisions, as most constituents have an ARM rank above 70 which is considered a bullish signal (1 = worst, 100 = best).
Exhibit 5: FY1 EPS Revisions for week ending August 9th, 2022
Net Margins starting to decline?
As noted in our STOXX 600 earnings preview (STOXX 600 22Q2 Earnings Preview: Focus on Growth ex. Energy, July 12, 2022), margin pressure has been a key theme during earnings call from management who have highlighted continued inflation pressure with some companies passing on higher costs to consumers while others have absorbed them.
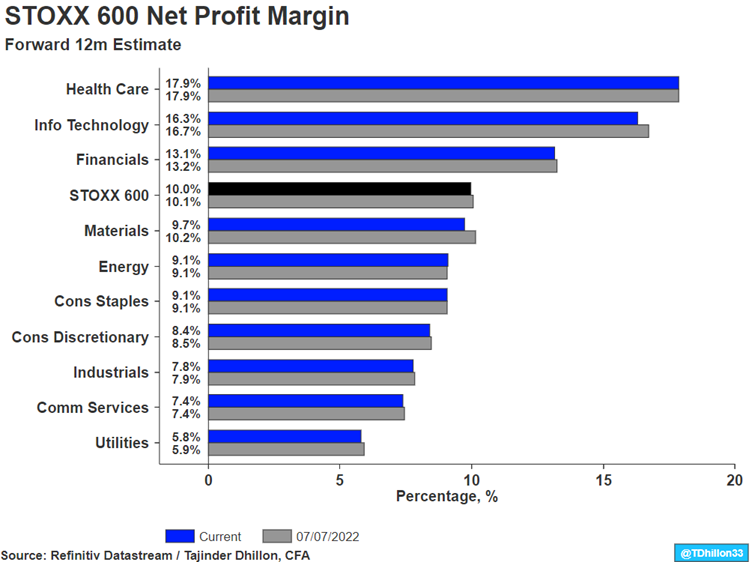
The forward 12-month net profit margin for the STOXX 600 reached an all-time high of 10.5% last month and has slightly come down to 10.0% as shown in Exhibit 6.
Materials has seen the largest decline over the month, declining by 50 basis points (10.2% vs. 9.7%), followed by Information Technology (40 bps), and Financials (10 bps). No sector has seen their forward 12-month profit margin rise over this period which may indicate increased caution from analysts heading into the second half of the year.
Exhibit 6: STOXX 600 Net Profit Margin
While results in the aggregate have been better than expected to date with growth driven by energy earnings and continued strength in margins, it remains to be seen if this can continue into the second half of the year.
Refinitiv Workspace is a complete solution for research and analytics. It places the most comprehensive market information, news, analytics and trading tools available into a desktop.
Refinitiv I/B/E/S Estimates are a market leader, boasting 200+ metrics and indicators across 15 industries. Find more information on our estimates data.
Refinitiv Datastream – Financial time series database which allows you to identify and examine trends, generate and test ideas and develop viewpoints on the market.
Get unique value-add analytics and predictive financial modeling, dedicated to making investment research smarter with Refinitiv StarMine data.


