There is a paradox in the state of the US economy that is creating something of a conundrum for decision-makers. On the one hand, the US economy has shown resilience in the face of higher rates, while inflation has proved to be stickier than expected. It is therefore almost certain that the FOMC will keep the federal funds rate unchanged when it concludes its two-day meeting on 1 May.
Even the 2024 Q1 GDP report, which showed weaker-than-expected growth of 1.6%, annualised, dampened investors’ expectations of rate cuts: Treasury yields increased in response to the release, as the detail showed that domestic demand remained strong.
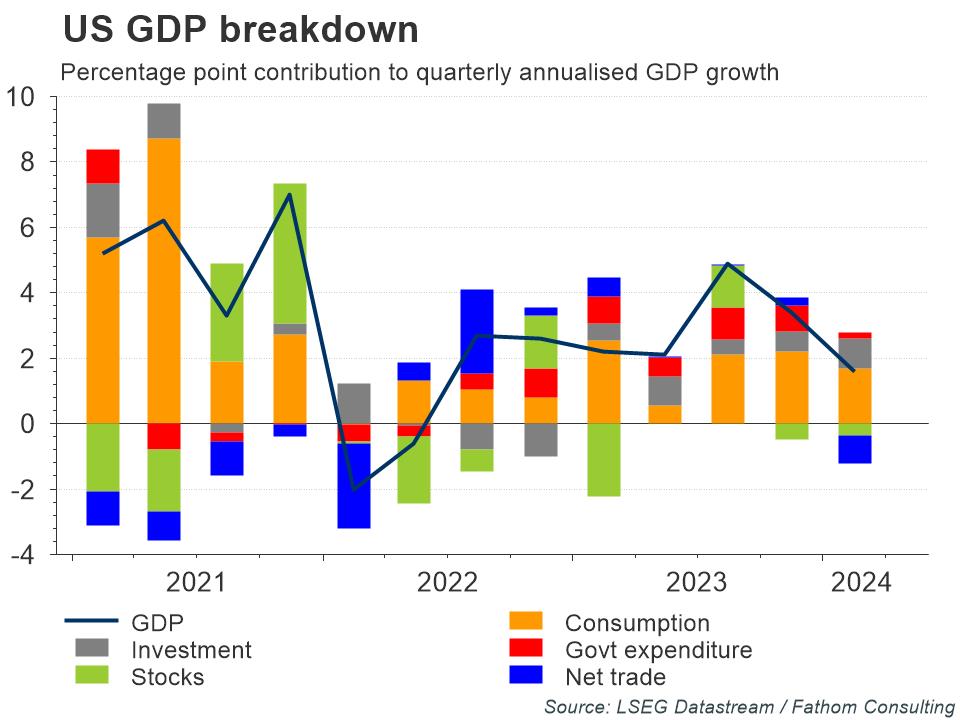
Refresh this chart in your browser | Edit the chart in Datastream
Other data for March, such as US nonfarm payrolls and CPI inflation, also paint a picture of a strong economy with lingering inflation pressures: 303,000 new payrolls were added in March, while headline inflation edged up from 3.2% to 3.5%; some measures of core inflation increased too.
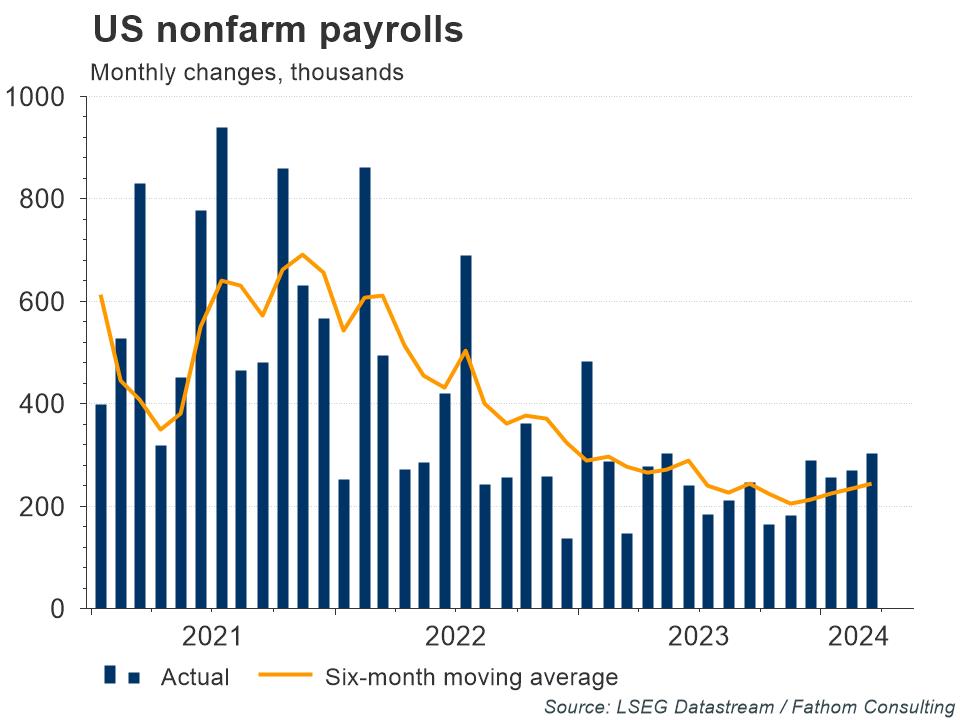
Refresh this chart in your browser | Edit the chart in Datastream
Want more charts and analysis? Access a pre-built library of charts built by Fathom Consulting via Datastream Chartbook in LSEG Workspace.
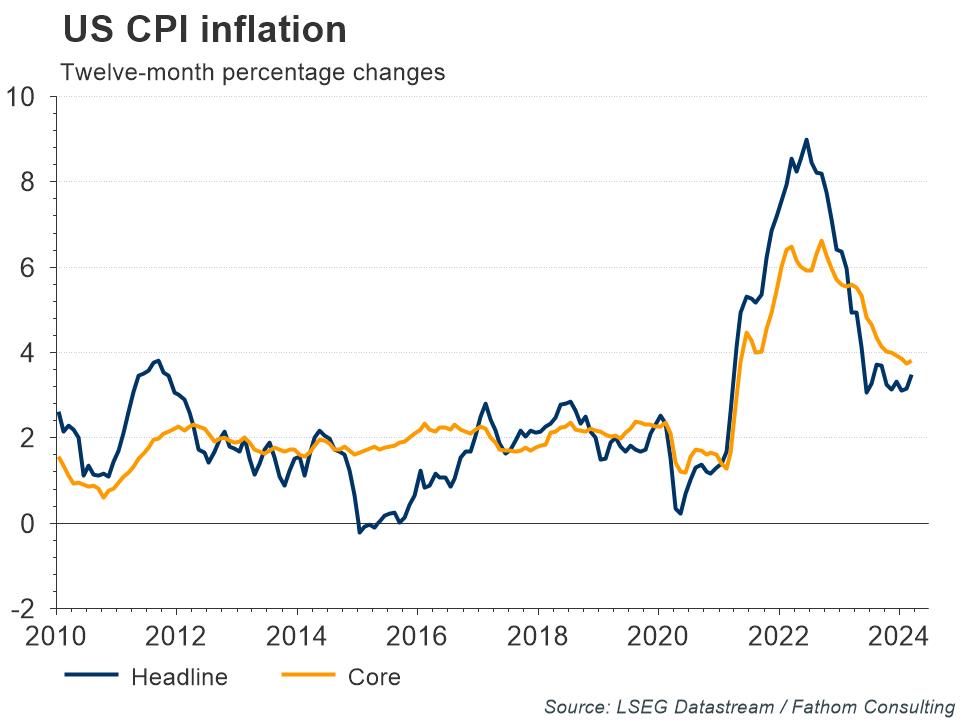
Refresh this chart in your browser | Edit the chart in Datastream
Indeed, the FOMC chairman Jerome Powell, who had previously expressed confidence that inflation was coming under control, recently said that “it’s likely to take longer than expected to achieve that confidence”, and that the committee could “maintain the current level for as long as needed”. Meanwhile, some commentators, like Larry Summers, have said that the next move in US interest rates could be up, rather than down.
Looked at from another angle, however, such hawkishness seems somewhat overdone. Yes, payrolls were strong, but other labour market indicators point to easing inflationary pressures: for example, the quit rate, vacancy rate and wages per employee-hour-worked have all been falling, and are converging with their pre-crisis levels.

Refresh this chart in your browser | Edit the chart in Datastream
Which set of indicators is more to be believed? The FOMC is aware of these contrasting signals. One factor that has received less attention, at least from economists, and which may help to resolve this paradox, is immigration.
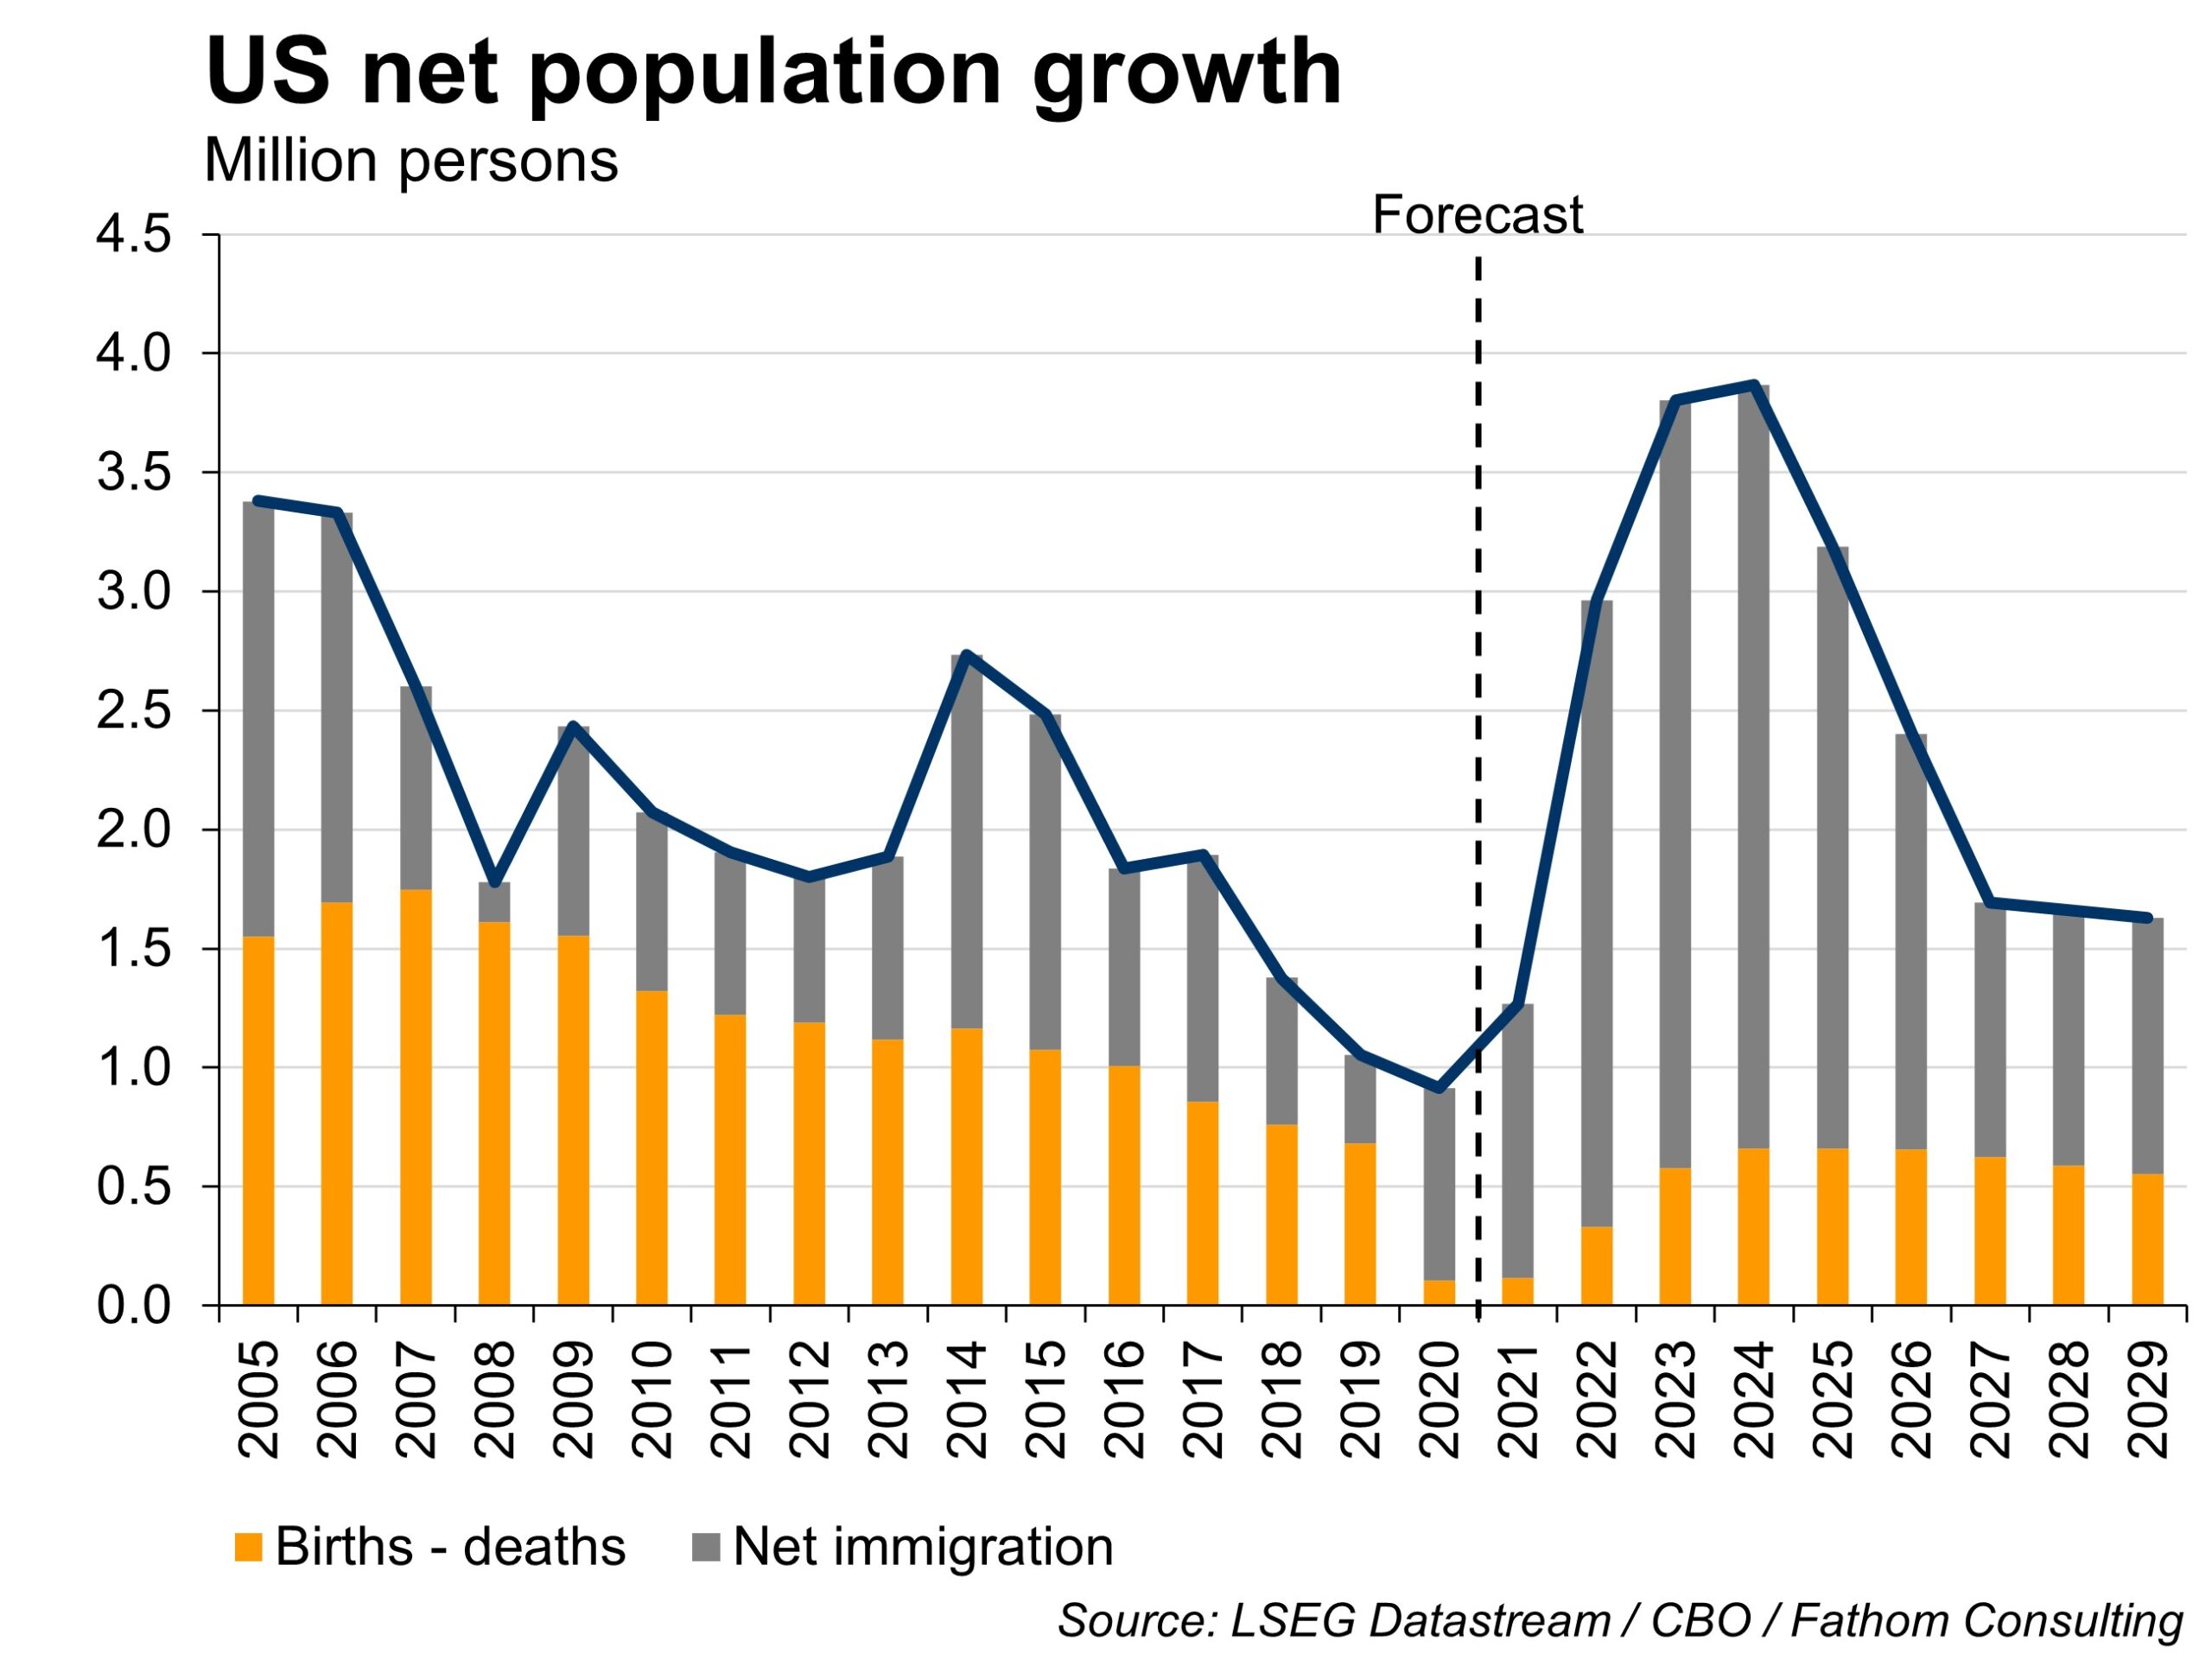
According to Fathom calculations using Congressional Budget Office (CBO) estimates for population growth, the US population has increased sharply over the past couple of years, and by 3.2 million people alone in 2023, mainly due to immigration. This has contributed to the expansion of the labour force, where enough jobs are being created to absorb it, allowing ample job creation without a spike in wage growth — in other words, the US labour market is getting bigger, not tighter.
This is certainly a tail wind for the Fed as, in the absence of an increasing labour supply, wage growth would have been very problematic for the inflation outlook. CBO projections point to the increases in the work force continuing over the coming years. This would give the Fed more scope to ease monetary policy as the thing that matters for inflation and the rate outlook is the tightness of the labour market and not its size. But it is also worth considering that these projections are subject to a high degree of uncertainty, as the current more favourable stance towards immigration could be rescinded in the event of a change in government later this year.
The views expressed in this article are the views of the author, not necessarily those of LSEG.
____________________________________________________________
LSEG Datastream
Financial time series database which allows you to identify and examine trends, generate and test ideas and develop viewpoints on the market.
LSEG offers the world’s most comprehensive historical database for numerical macroeconomic and cross-asset financial data which started in the 1950s and has grown into an indispensable resource for financial professionals. Find out more.

