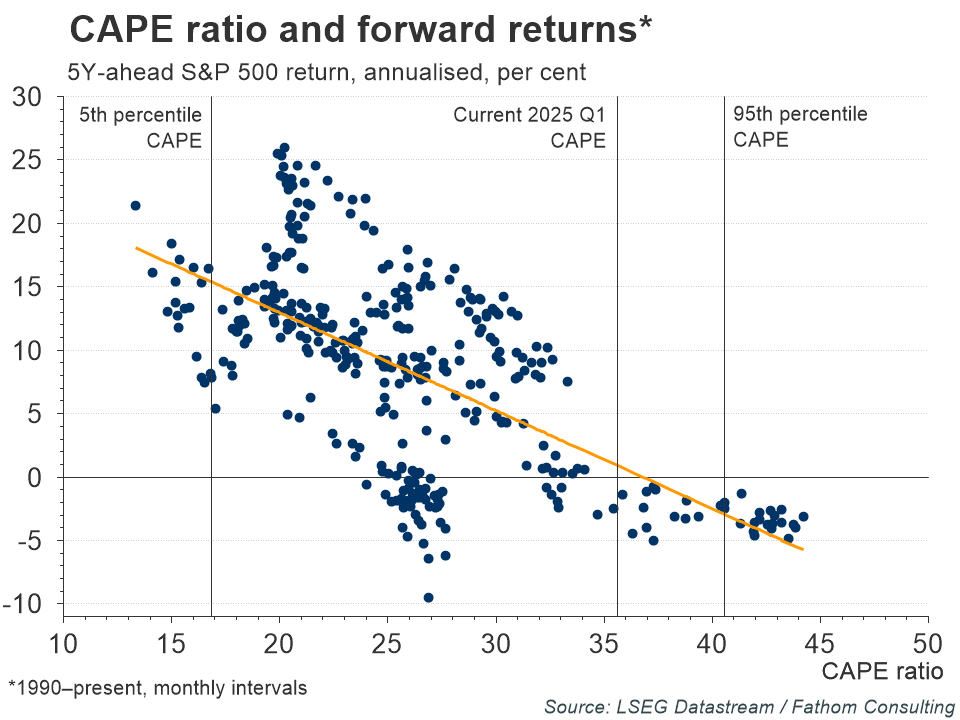
The markets sell-off since President Trump’s ‘Liberation Day’ tariff announcements took hold in an environment where, as Fathom has previously suggested,[1] US stocks were supported more by sentiment than by fundamentals. Shiller’s cyclically adjusted price-to-earnings (CAPE) ratio produces a valuation multiple by dividing the current price of the S&P by its inflation-adjusted average earnings over the past 10 years. It can provide clues as to whether the market is relatively over- or undervalued compared with historical earnings. The chart shows the CAPE ratio plotted against the five-year ahead returns of the S&P (annualised) from 1990 onwards. Both variables are on a monthly frequency. There is a strong negative correlation of -0.64 between CAPE and forward returns — that is, higher values of the CAPE ratio are associated with lower future returns. We can see that all CAPE values over 35 are typically associated with negative 5Y-forward annualised returns. The current value of CAPE is 35.6, having reached a high of 37.7 on 31 December 2024. In other words, one might argue that the elevated CAPE ratio was indicative that there was already a high likelihood of an eventual correction, even before the latest round of tariff announcements.
Refresh this chart in your browser | Edit the chart in Datastream
[1] https://lipperalpha.refinitiv.com/2025/01/news-in-charts-us-resilience-masks-deeper-global-instability/
The views expressed in this article are the views of the author, not necessarily those of LSEG.
______________________________________________________________________________________
LSEG Datastream
Financial time series database which allows you to identify and examine trends, generate and test ideas and develop viewpoints on the market.
LSEG offers the world’s most comprehensive historical database for numerical macroeconomic and cross-asset financial data which started in the 1950s and has grown into an indispensable resource for financial professionals. Find out more.

