
Passive bond sales are a rare venture into the black, as equities see almost £7bn redemptions.
Asset Class View
- Gross redemptions for the month were £10.5bn, with the biggest outflows from equity vehicles.
- Only net inflow at the asset class level was for Real Estate, with £252m.
Active v Passive
- Active to passive bond sales mirrored one another, with approximately £1.4bn outflows from the former and into the latter.
- ETFs took £906m over the month, as passive mutual funds saw outflows of £1.3bn, with £2.8bn of redemptions from passive equity mutual funds.
Classifications
- Bond classification, led by GBP Government, were the top five selling classifications, totalling £2.5bn between them.
- Equity UK saw the largest outflows, at more than £2bn.
ESG Flows
- Bonds were the top selling ESG asset class (£402m), with £421m outflows from their conventional peers.
- Despite challenging market conditions, ESG equity sales remain (just) in the black, at £38m.
Asset Manager View
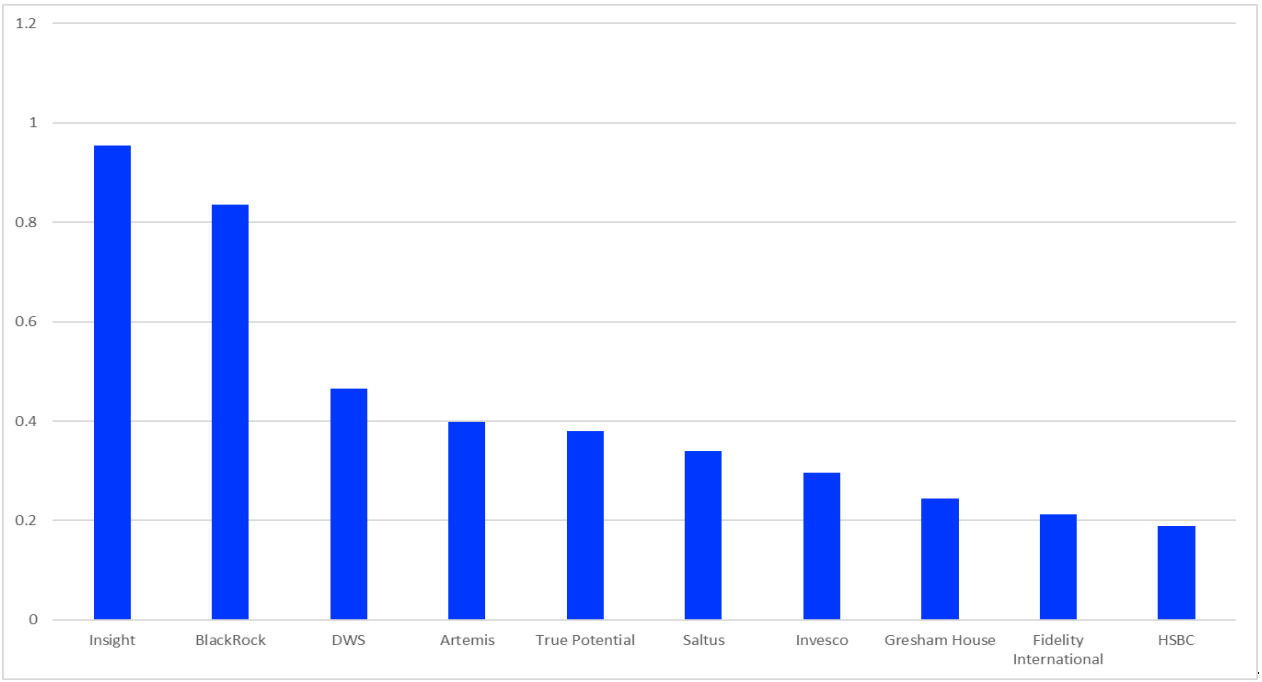
- Insight and BlackRock were the top-selling asset managers, with inflows of £954m and £835m, respectively.
Flows by Asset Class
Chart 1: Asset Class Flows, Active and Passive, June 2022 (£bn)

Source: Refinitiv Lipper
Over June, the FTSE 100 fell by 5.75%, with a 7.6% fall between 7 and 17 June. Over the month, the FTSE UK Value TR index, which had outperformed YTD, fell by 6.12%. In a year dominated by the outperformance of energy and value stocks, this eroded the energy and value-heavy performance of UK equities. Nevertheless, the UK still outperformed the S&P 500, which fell 8.4% over the month.
Equities overall were the least loved asset class, with redemptions of £6.9bn, £2.8bn of which were from passive funds.
For once, money market flows aren’t significantly shifting the dial: total flows for the month stood at -£10.5bn; excluding money market cash, this was -£9.4bn. Active strategies bore the brunt of both, seeing outflows of £9.3bn and £8.1bn, respectively.
The yield on the 10-year gilt finished pretty much where it started (about 2.1%) over the month, peaking at 2.65% on 21 June. Meanwhile, bond flows were marginally negative (-£19m), which mased a situation of circa £1.4bn outflows from active funds, and a touch less (well, £19m less) into passives.
Mixed-assets funds saw outflows of £1bn, throwing May’s inflows of £1.8bn into reverse. Mixed assets flows have been resilient of late, likely from retail investors deploying cash squirreled away over COVID. If this reversal is sustained, it may be an indication of changing sentiment as investors accommodate rising costs and tightening belts.
Chart 2: Passive Asset Class Flows, Mutual Funds v ETFs, June 2022 (£bn)

Source: Refinitiv Lipper
Net passive flows for June were £1.3bn, in contrast to £9.3bn of active money outflows. As in July, the winners here were bond funds, with passive mutual funds taking £1.4bn and ETFs £939m.
In contrast, as with their active peers, it’s been a grim month for passive equity, with redemptions from mutual funds (£2.8bn) and ETFs (£29m). And, again like last month, most inflows for alternatives were accounted for by a fund replicating index-linked gilts.
Flows by Classification
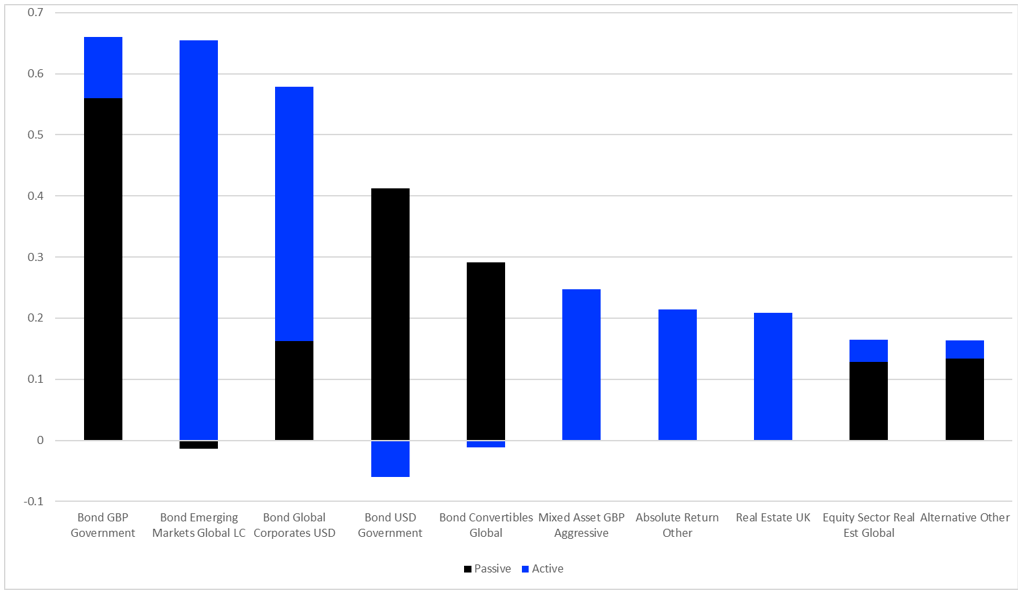
Chart 3: Largest Positive Flows by Refinitiv Lipper Global Classification, June 2022 (£bn)
Source: Refinitiv Lipper
The top five classifications in June are all bonds, totalling £2.5bn.
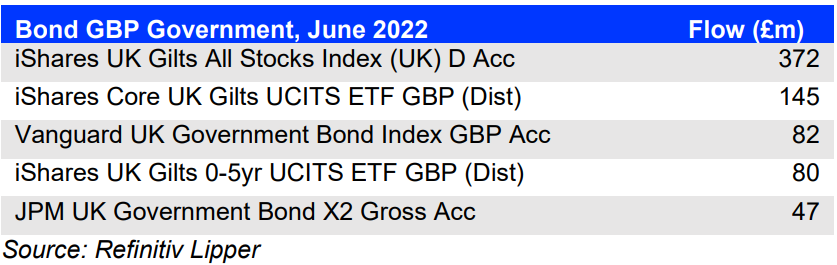
Unusually, Bond GBP Government tops the chart this month (£660m)—possibly a sign that fund buyers are battening down the hatches in expectation of recession, plus yields on the 10-year gilt hitting their highest since 2014.
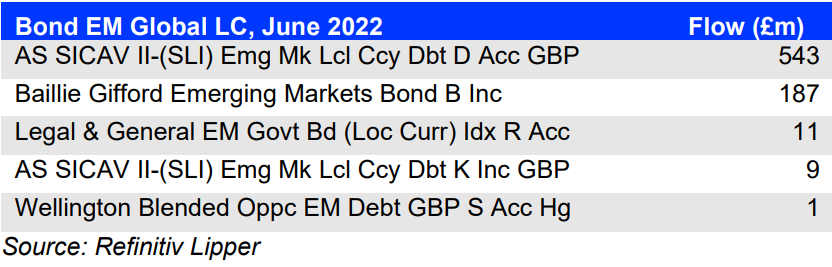
Next comes Bond Emerging Markets Global LC (£641m). Their hard currency peers have seen slight outflows (-£7m). However, local currency debt, by definition, doesn’t have the same vulnerability to rising US rates as does hard currency, and yields are looking attractive. Hard currency EM debt is likely to be only for the brave until the Fed gets close to the end of tightening.
It’s interesting to see Real Estate UK (£209m) and Equity Sector Real Estate Global (£165m) make a showing. Property—especially direct—has been out of favour for years. With rents generally linked to inflation, it has obvious advantages in this environment. However, if we do go into recession in H2, things will play out differently. Commercial property values are closely linked to net operating income, gross rental income, and expenses. Recessions see occupancy rates decline and late payments increase.
Overall, this looks like a market that is positioning for stagnating growth, if not outright recession, more than for inflation—though there are still elements of the latter.
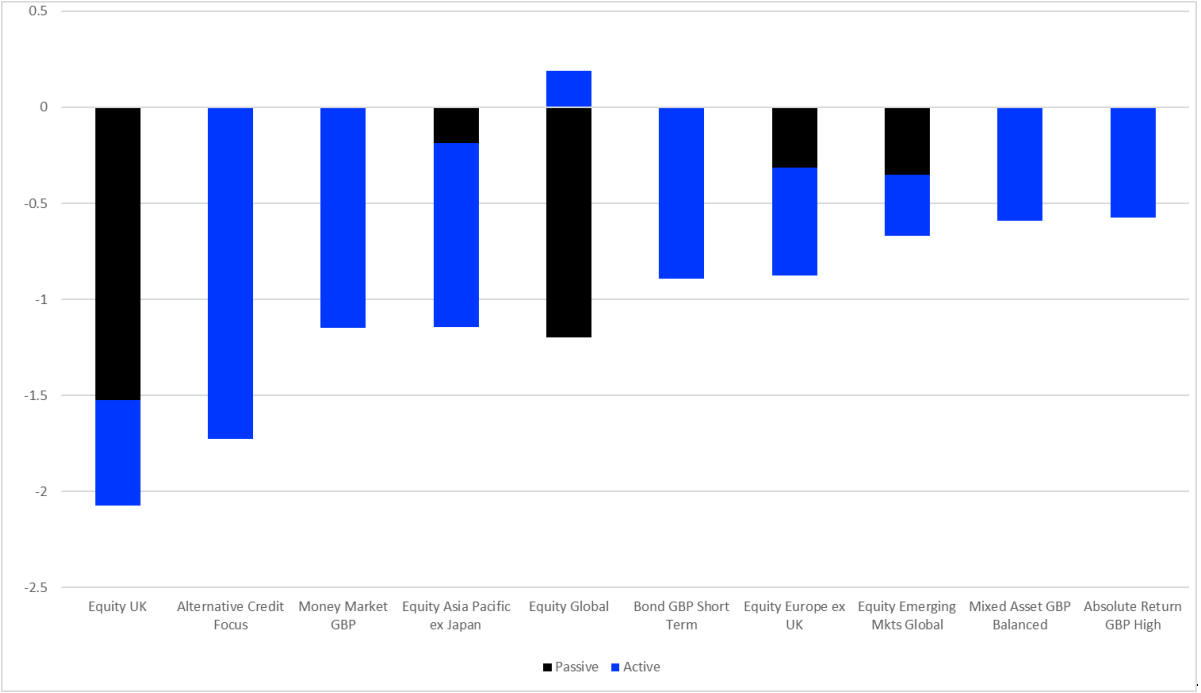
Chart 4: Largest Negative Flows by Refinitiv Lipper Global Classification, June 2022 (£bn)
Source: Refinitiv Lipper
As I wondered in a recent feature, what’s an equity market got to do to get some attention around here? Despite outperformance YTD, t’s been another brutal month for Equity UK, with redemptions of £2.1bn, with £1.5bn of this being active money.
There is a broad withdrawal of assets from equity markets, from Equity Asia Pacific ex Japan (-£1.1bn) and Equity Emerging Markets Global (-£670m) to the previously perennial favourite of Equity Global (-£1bn).
More than £1.5bn has been withdrawn from Alternative Funds investing in ABS this month, with these funds sitting in Alternative Credit Focus and accounting for most of the classification’s £1.7bn redemptions.
The £893m redemptions for Bond GBP Short Term militate against a market that’s full throttle on protecting itself against the ravages of inflation, although it’s a very uneven picture.
ESG Flows
Chart 5: ESG Asset Class Flows, June 2022 (£bn)

Source: Refinitiv Lipper
Despite fund buyers’ increasing risk aversion, we’ve yet to see monthly ESG equity fund flows go negative, although we’re sailing pretty close to the wind, at just £38m of net flows in June—barely visible on the bar chart above. However, despite the negative flows for Equity Global as a whole, Equity Global ESG funds still seem to be taking the greatest part of ESG equity flows.
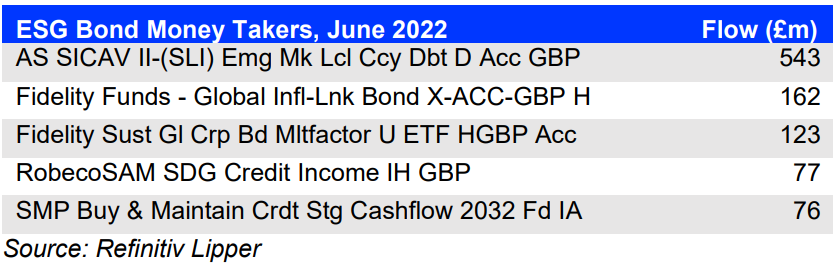
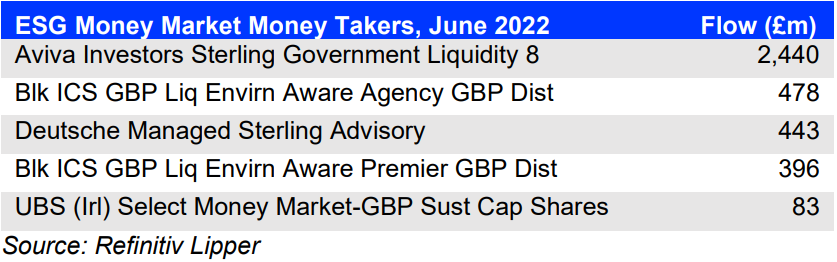
The best selling ESG asset class was bonds, at an albeit modest £402m, followed by money market at £165m, despite net outflows for the latter asset class of £1.1bn. In line with broader trends for June, the best-selling fixed income share class was an emerging market bond, followed by a global inflation-linked bond fund, indicating that inflation is still a focus for many. Interestingly—to me, at least—there’s a similar trend in bonds as we saw with active and passive, with outflows from the former almost mirroring the inflows to the latter, as ESG bond funds took just a little less than their non-ESG peers shed.
Flows by Promoter
Chart 6: Largest Positive Flows by Promoter, June 2022 (£bn)
Source: Refinitiv Lipper
Insight (£954m), BlackRock (£835m), and DWS (£465m) were the month’s top-selling companies.
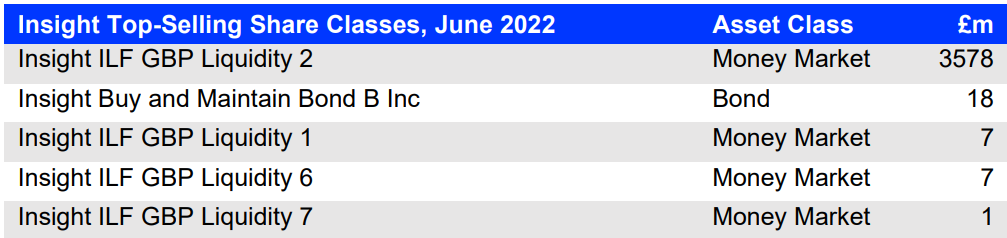
Money market funds took Insight into the black, with £3.3bn of sales in the asset class.
Source: Refinitiv Lipper
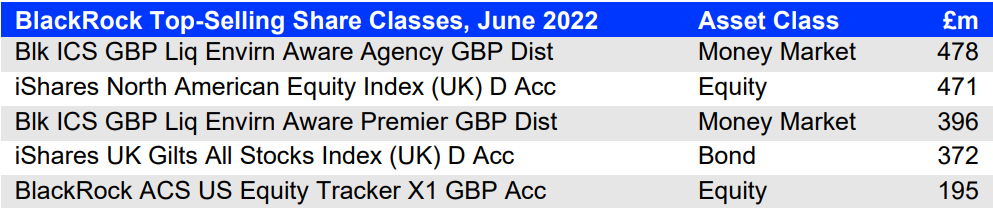
Meanwhile, BlackRock’s biggest sellers were bond funds, at £789m, followed by £150m of money market funds.
Source: Refinitiv Lipper

