Introduction
The past performance of a mutual fund is no indicator of future performance. But the past relative performance of an actively managed mutual fund or ETF compared to its fund manager benchmark shows if the respective fund manager was able to fulfill the marketing promise of an outperformance compared to the fund manager benchmark. This means such an analysis verifies if the fund was worth the higher fees for active management or if the investor would have been better off by simply buying the benchmark via a passive product such as an ETF.
The analysis of the performance of a fund or ETF leads naturally to a discussion around which time period might be appropriate for the analysis. Some investors want to invest in funds which are able to beat their benchmark year after year, while others might want an outperformance after three, five, or even 10 years.
As we are agnostic to the time periods, we analyzed all one-year, three-year, and five-year periods, as well as the overall 10-year period in this study.
Methodology
To evaluate if actively managed global equity funds are delivering a value added for investors, we calculated the relative performance of the funds to their respective fund manager benchmark. This approach ensures that we compared the performance of the fund with the performance target stated in the fund documents. Unfortunately, this approach does have a negative impact on the size of the peer group, since not all funds—especially outside the EU—provide a fund manager benchmark. In addition to this, not all fund manager benchmarks are available within the Lipper database.
The peer group for this study was built by choosing the primary share class (the portfolio) of all actively managed mutual funds and ETFs within the Lipper Global Classification Equity Global, which have been launched before January 1, 2013. In addition, the asset status had to be active on April 26, 2023. This screen led to the so-called survivorship bias, as those funds which had been closed within the 10 years period between January 1, 2013, and December 31, 2022, are not reflected within the statistics of this study. This means that it is likely that this study is overstating the percentage of funds which were able to outperform their fund manager benchmark since it seems to be a valid assumption to state that successful funds won’t get closed by fund promoters. These filters brought the number of constituents to 2,081 funds. The availability of the respective fund manager benchmark brought the size of the peer group to 1,099 funds.
We calculated the relative performance of the funds versus their fund manager benchmarks for all one-year, three-year and five-year periods starting at January 1 of each year, as well as the 10-year period from January 1, 2013, to December 31, 2022. All calculations were made in EUR.
More general, it is fair to say that this study covers all actively managed funds globally which are listed as Equity Global in the Lipper database and which have been launched before January 1, 2013 (n=1,099).
Analysis of One-Year Periods
Normally one would say that a view on the one-year period is too short for the evaluation of equity funds as there are too many external factors which can impact the performance of the fund or the fund manager benchmark in one way or the other.
Nevertheless, some investors would like to see their fund outperforming its fund manager benchmark every single year, as this is the ultimate goal for an actively managed fund.
379 funds beat their fund manager benchmark on average every year, while the actual number varies between 484 and 217 funds as shown in graph 1.
That said, only one fund was able to beat its fund manager benchmark in every year of the analysed time period.
Graph 1: Number of Outperforming Funds (January 1, 2013 – December 31, 2022)

Source: Refinitiv Lipper
As mentioned above, the one-year period is too short to evaluate if an actively managed fund can add value for the investors since single market events or style drifts can have a massive impact on the performance of the fund and/or the fund manager benchmark and can favor one of the other.
Nevertheless, it is surprising that only one fund were able to beat its fund manager benchmark year after year over the analysed 10-year period.
Analysis of Three-Year Periods
Even as three years seem to be a relatively short time period to evaluate the performance of equity funds, it is a time period which is used by professional investors and fund selectors.
299 funds were able to beat their fund manager benchmark on average over the three-year periods analyzed in graph 2, while the actual number of funds varies between 368 and 213 funds.
As the time periods get longer, it is not surprising that the number of funds which beat their respective fund manager benchmark over every time period is increasing. Nevertheless, only 20 funds were able to beat their fund manager benchmark over every three-year period.
Graph 2: Number of Outperforming Funds (January 1, 2013 – December 31, 2022)
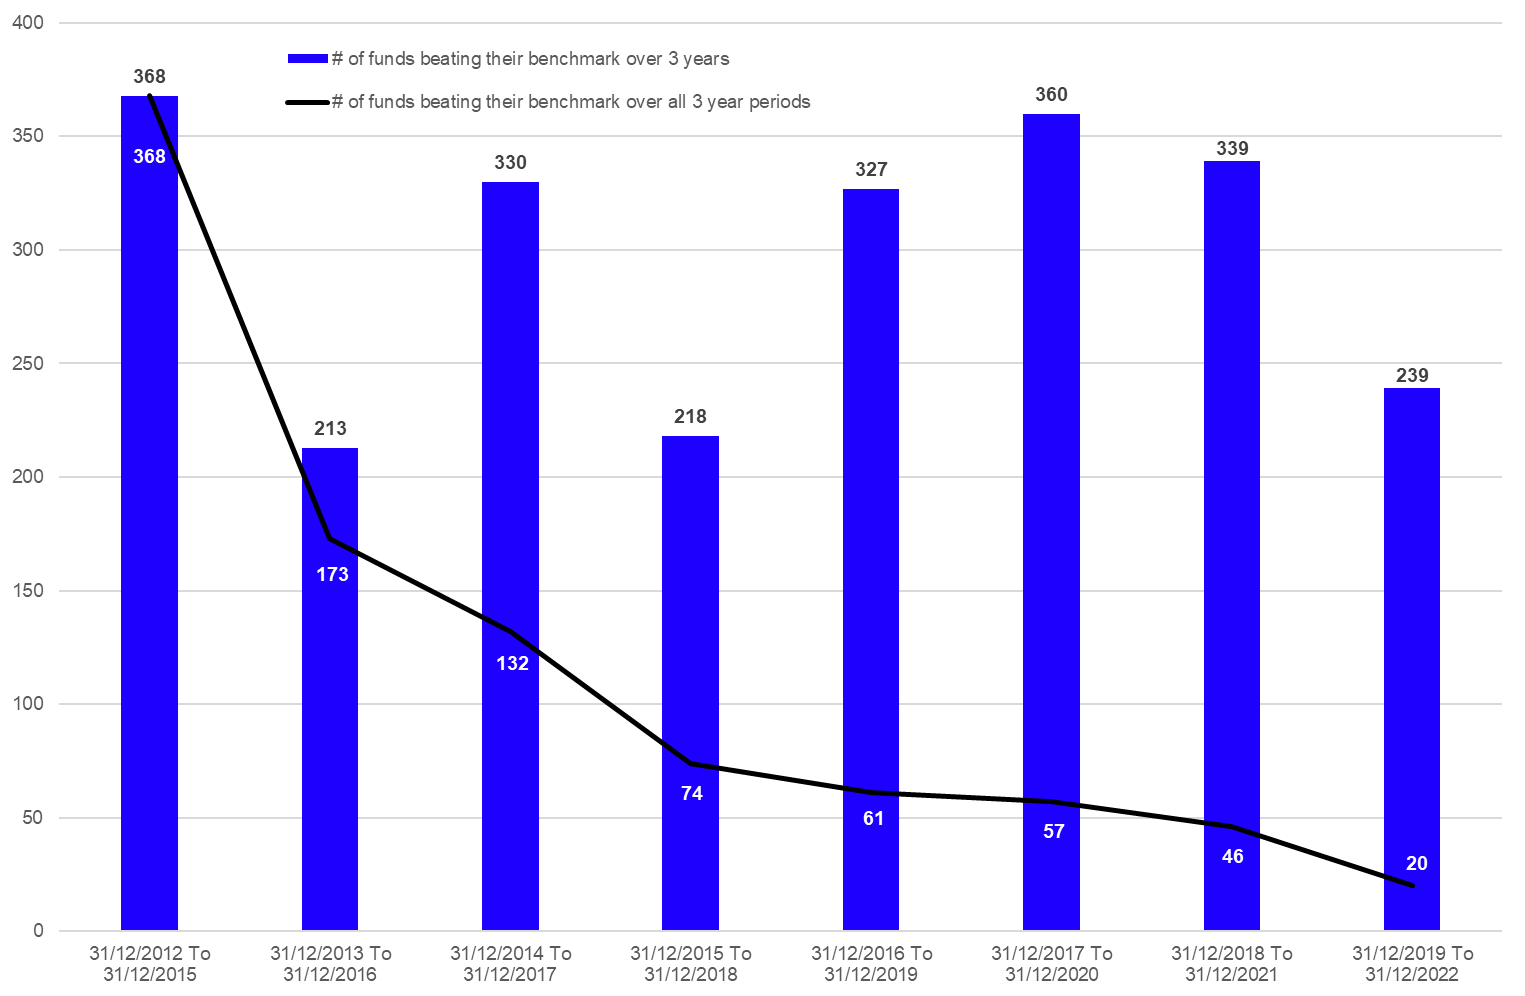
Source: Refinitiv Lipper
Analysis of Five-Year Periods
The five-year period seems to be long enough to evaluate the performance of equity funds, as this time period allows the fund manager to adjust the portfolio to changing market conditions and/or style drifts. It also allows the fund manager to gain back performance in case of an underperformance in single years of the evaluation period. As said before, it is not surprising that the number of funds which can beat their fund manager benchmark goes up, the longer the respective time period gets.
In more detail, 262 funds were able to beat their fund manager benchmark on average over the five-year periods analyzed in graph 3, while the actual number of funds varies between 327 and 194 funds. That said, it is surprising that the lowest number of funds beating their fund manager benchmarks has been found over a five-year period (194).
It is also surprising that on average less funds show an average outperformance over the five-year period (262) than over the three-year period (299).
Nevertheless, 58 funds were able to beat their fund manager benchmark over every five-year period.
Graph 3: Number of Outperforming Funds (January 1, 2013 – December 31, 2022)
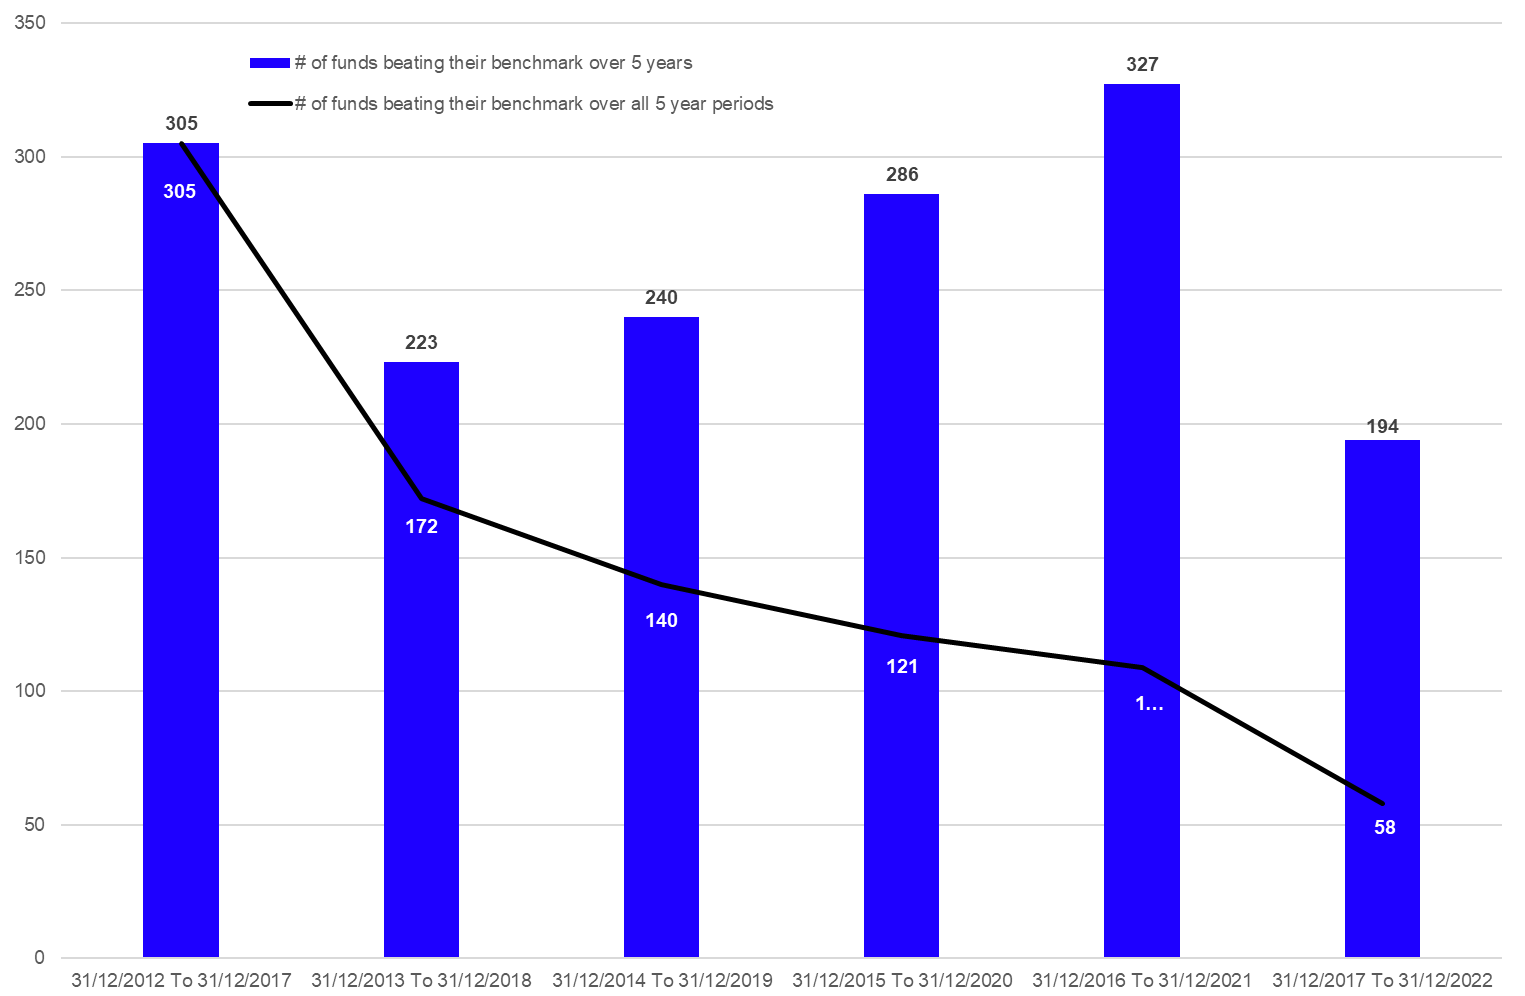
Source: Refinitiv Lipper
Summary
The results of this study showcase that it is very hard for fund selectors and especially retail investors to find a global equity fund which will be able to beat its fund manager benchmark over various time periods. This performance pattern might be one reason why passive investment products such as ETFs or index tracking mutual funds are increasingly becoming the instruments of choice for professional, as well as retail investors.
Nevertheless, there were 203 actively managed mutual funds and ETFs which have beaten their respective fund manager benchmark over the 10-year period. This means that investors who have chosen an actively managed mutual fund for their portfolio might need some patience before the active approach of the manager pays off, as not all active management approaches are in favor of all market conditions. On the other hand, it might be better to pull the plug if an actively managed fund doesn’t meet his self-defined investment goals over a given time period.
Disclaimer
This article is for information purposes only and does not constitute any investment advice. Investors should consult their investment advisor and/or the fund documents before making any investment decision.
The views expressed are the views of the author, not necessarily those of Refinitiv Lipper or LSEG.

