January 2025 was another month with strong inflows for the European ETF industry.
These inflows occurred in a mainly positive but volatile market environment. The markets were driven by the effects around the inauguration of Donald Trump as the next U.S. president. On one hand, investors appreciated the expected positive impacts on the U.S. economy from the new administration. Meanwhile, they feared the impacts from possible tariffs, which may cause a global trade war as an unwanted side-effect and higher government spending on the inflation and, therefore, on the resulting policies of the U.S. Federal Reserve. That said, the high valuations of the market leaders and the more hawkish statements from the U.S. Federal Reserve led to an environment in which investors are somewhat nervous and reacting quickly on any news that may impact the current market environment negatively.
That said, investors are not only focusing on economic news, as the geopolitical tensions in the Middle East—especially the developments around the Red Sea—are seen as a risk for the general economic growth in Western countries. While a possible peace agreement between Israel and the Hamas may lead to a lower price for oil, the activities of the Houthi rebels are still a concern since a number of shipping companies these days avoid the passage of the Suez channel. It is, therefore, to be expected that prolonged delivery times can cause some tensions for the still vulnerable delivery chains.
As mentioned above, market sentiment was also further driven by the expectations of investors for future central bank decisions. Since the different regions of the world are showing different growth patterns, it is to be expected that central banks will follow different paths with regard to their interest rate policies. Even as investors were already expecting less activity from the U.S. Federal Reserve, the somewhat hawkish statements of some Fed members led to concerns about the future policy of the Fed. On the other hand, the European Central Bank (ECB) made rather dovish statements. Therefore, investors expect the interest rate in the Eurozone to decline significantly over the course of 2025. As a result, such different central bank activity may lead to a stronger U.S. dollar compared to the euro and other leading currencies. With regard to this, any statement from the Fed and other central banks may have the power to move the bond market in one or the other direction. In addition, fears of increasing debt in the U.S. might be the driver for further increasing interest rates on the long end of the yield curve, which may have held back inflows into medium and long-term bond ETFs, while the still inverted yield curves might be the drivers for the inflows into money market ETFs.
That said, inverted yield curves and especially long-term inverted yield curves are seen as an early indicator for a possible recession. However, there are no signs for a recession in the U.S. and most other major economies visible yet. But even as it looks like the yield curves are slowly normalizing, this does not mean that there is no recession possible in the major economies around the globe. This is especially true as some major economies lack economic growth and may need lower interest rates as stimulus. Despite these headwinds, the positive effects of lower interest rates seem to be more important for investors than the current state of some economies.
From an ETF industry perspective, the performance of the underlying markets led, in combination with the estimated net flows, to increasing assets under management (from €2,082.2 bn as of December 31, 2024, to €2,162.3 bn at the end of January). At a closer look, the increase in assets under management of €80.1 bn for January was driven by the performance of the underlying markets, which contributed €51.1 bn to the growth of assets under management, while estimated net inflows contributed another €29.0 bn to the assets under management.
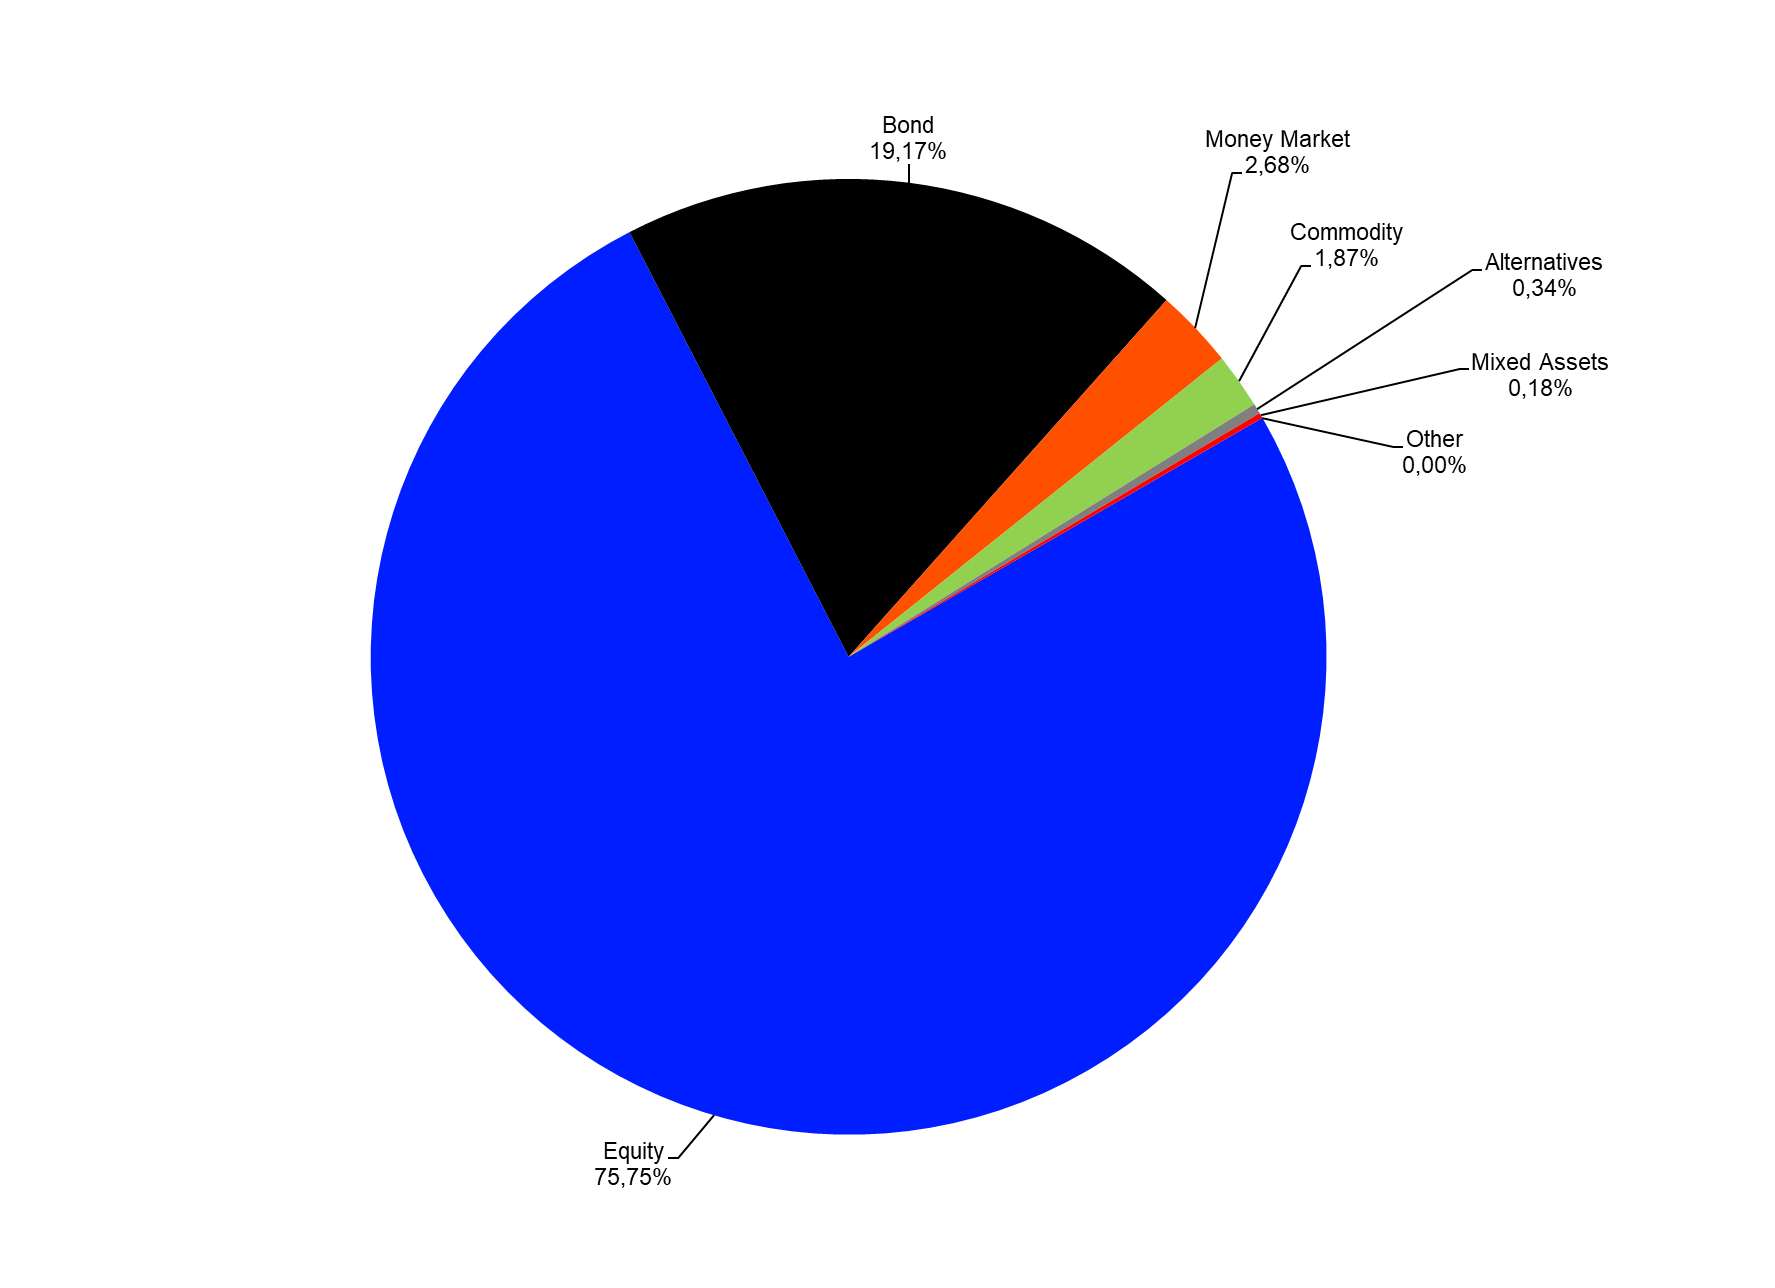
As for the overall structure of the European ETF industry, it was not surprising equity funds (€1,638.0 bn) held the majority of assets, followed by bond funds (€414.4 bn), money market products (€58.0 bn), commodities products (€40.5 bn), alternatives products (€7.5 bn), and mixed-assets funds (€3.9 bn).
Given the current market environment, it is no surprise that the overall assets under management in the European ETF industry (€2,162.3 bn) are going from one all-time high to the next month after month. With regard to this, it is no surprise that the assets under management for equity, bond, and money market ETFs also marked again an all-time high at the end of the month.
Graph 1: Market Share, Assets Under Management in the European ETF Segment by Asset Type, January 31, 2025
Source: LSEG Lipper
ETF Flows by Asset Type
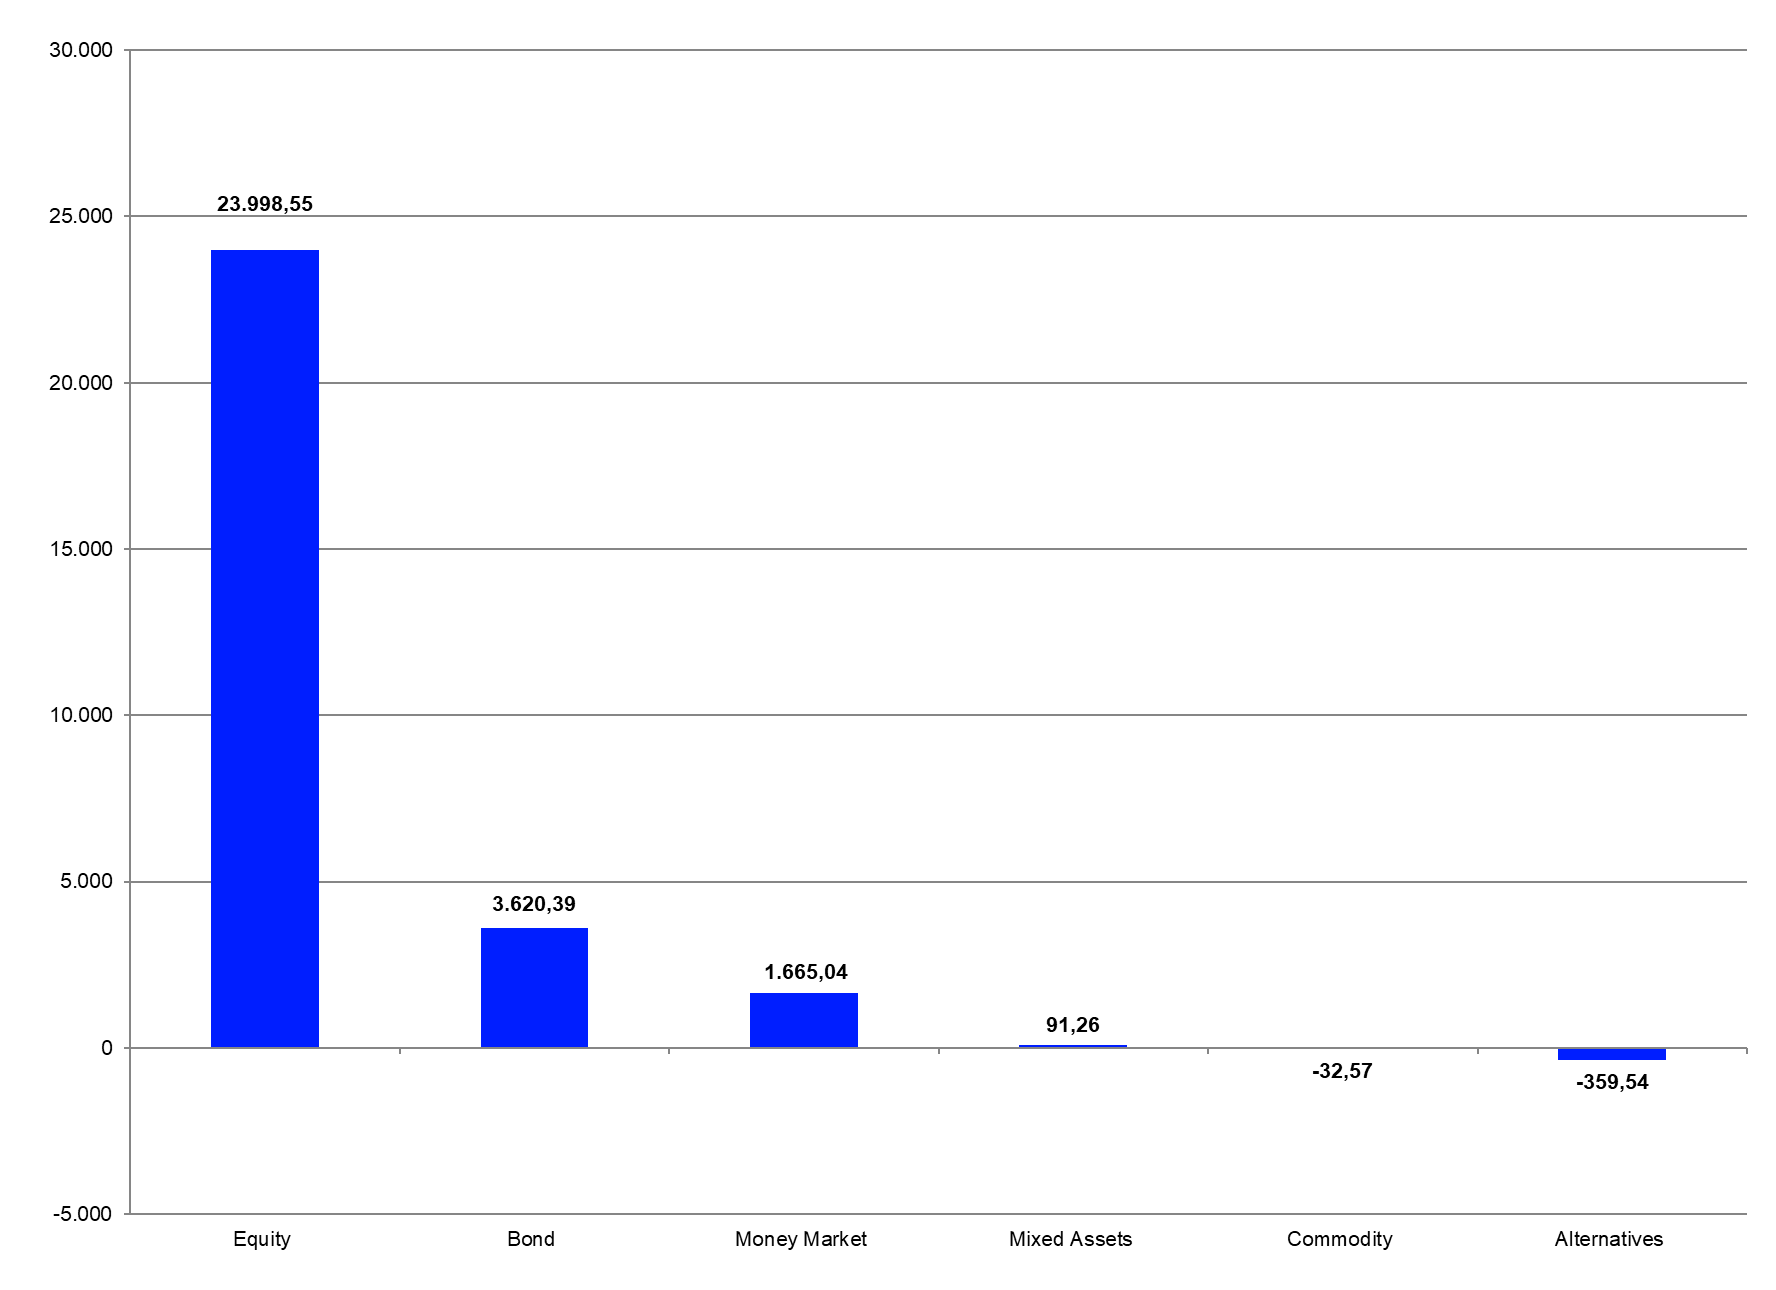
The European ETF industry enjoyed strong estimated net inflows (+€29.0 bn) over the course of January which marked a new all-time-high for monthly flows into ETFs in Europe. These flows were way above the rolling 12-month average (€22.0 bn).
The inflows in the European ETF industry for January were driven by equity ETFs (+€24.0 bn), followed by bond ETFs (+€3.6 bn), money market ETFs (+€1.7 bn), and mixed-assets ETFs (+€0.1 bn). On the other side of table, commodities ETFs (-€0.03 bn) and alternatives ETFs (-€0.4 bn) shed money.
Graph 2: Estimated Net Sales by Asset Type, January 2025 (Euro Millions)
Source: LSEG Lipper
Given the current market environment, it was no surprise to see high inflows into ETFs led by equity products over the course of January 2025. That said, the fact that bond ETFs enjoyed higher inflows than money market ETFs could be sign that European investors may expect a further normalization of the yield curves around the globe.
Assets Under Management by Lipper Global Classifications
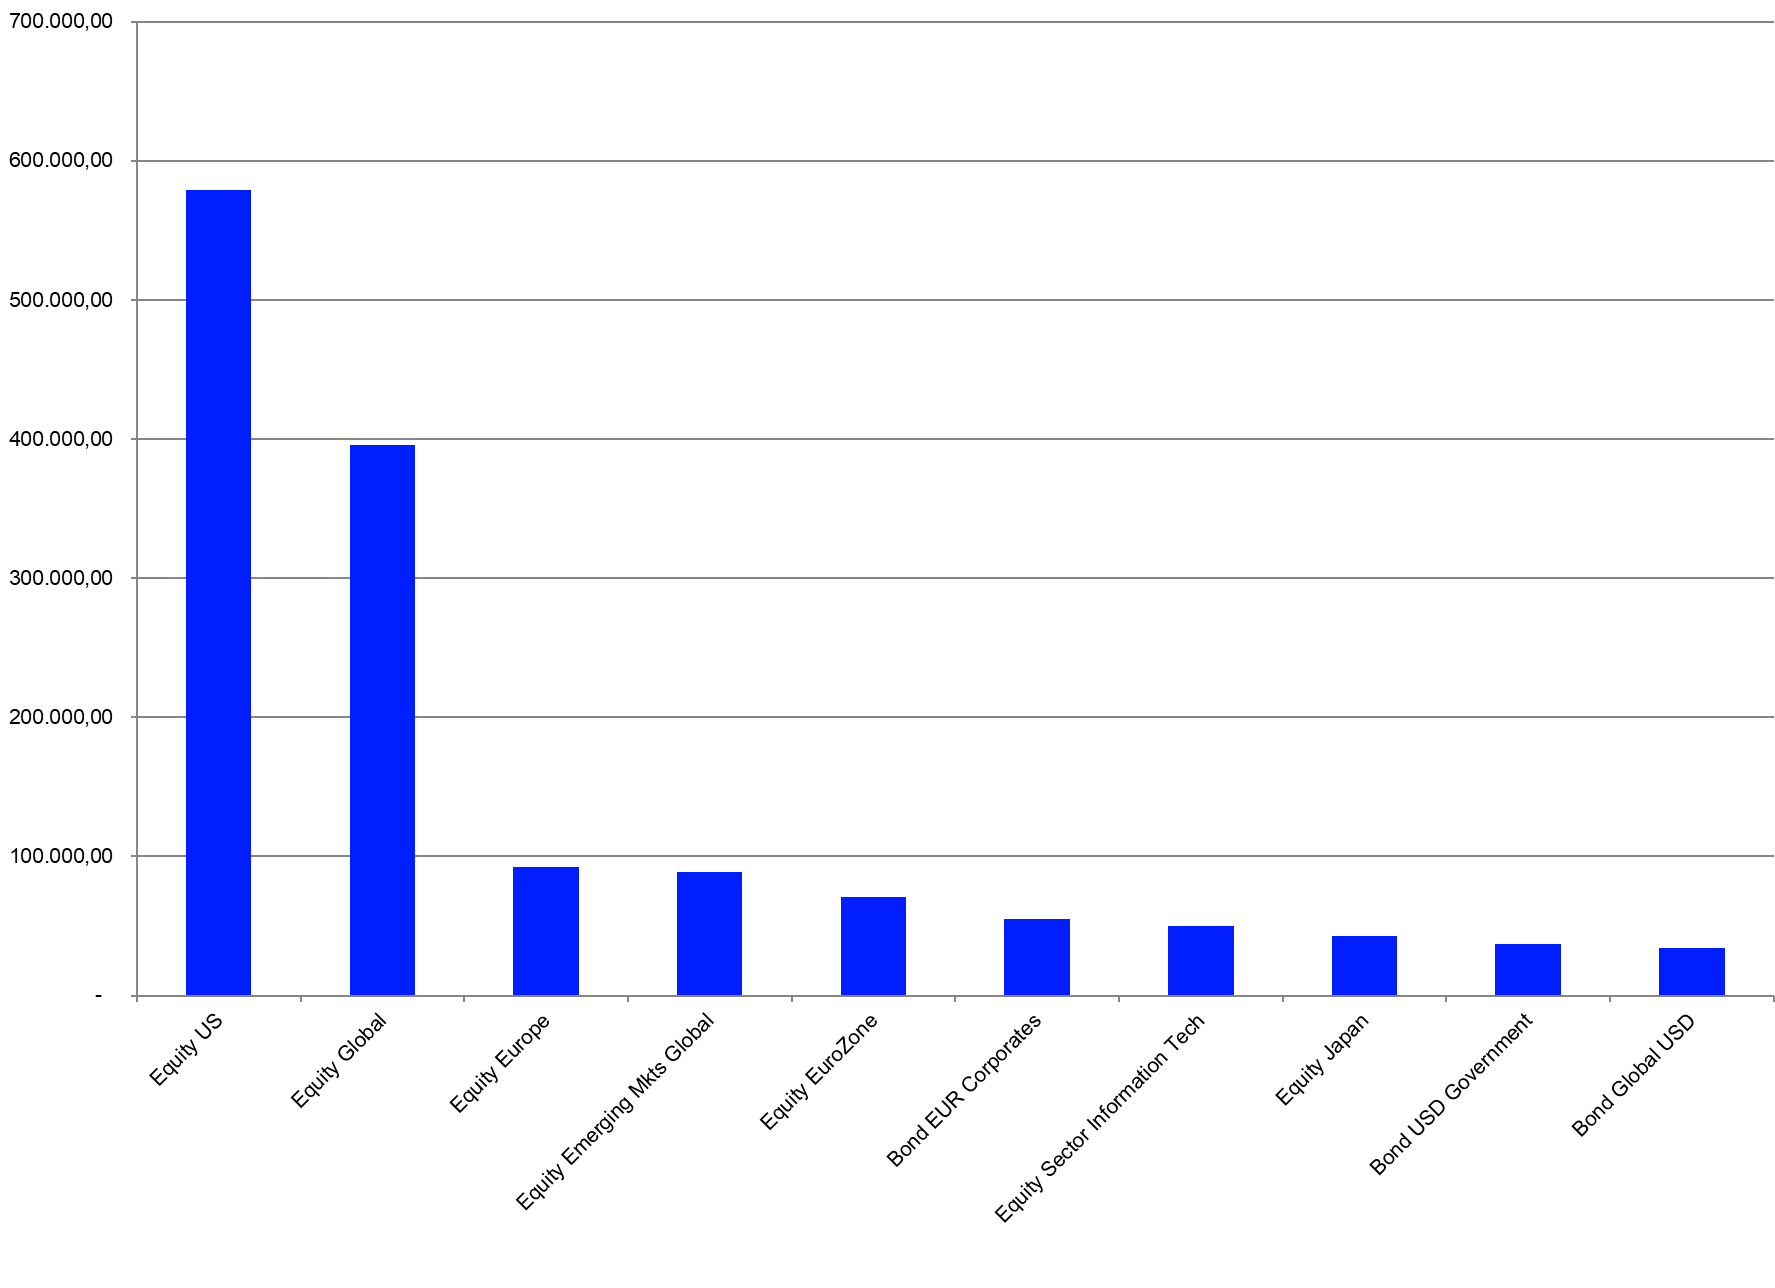
In order to examine the European ETF markets in further detail, a review of the Lipper global classifications will lead to more insights on the structure and concentration of assets within the European ETF industry. At the end of January 2025, the European ETF market was split into 175 different peer groups. The highest assets under management at the end of January were held by funds classified as Equity U.S. (€579.0 bn), followed by Equity Global (€395.4 bn), Equity Europe (€92.4 bn), Equity Emerging Markets Global (€89.1 bn), and Equity Eurozone (€70.1 bn). These five peer groups accounted for 56.73% of the overall assets under management in the European ETF segment, while the 10-top classifications by assets under management accounted for 66.89%.
Overall, 18 of the 175 peer groups each accounted for more than 1% of assets under management. In total, these 17 peer groups accounted for €1,666.0 bn, or 77.05%, of the overall assets under management.
Graph 3: Ten Largest Lipper Global Classifications by Assets Under Management, January 31, 2025 (Euro Millions)
Source: LSEG Lipper
In addition, it was noteworthy that the rankings of the largest classifications saw some movement in single positions over the last few years. As the positions of the classifications had been quite stable in the past, this indicates that European investors use ETFs to trade according to their market views. Even as some of these positions might be core holdings, once investors got into risk-off mode they also reduced their exposure to core asset classes.
That said, the ranking changes at the top of the league table which happened during the COVID-19 pandemic have not fully reversed since, but Equity Europe claimed back the third place from Equity Emerging Markets Global over the course of January. Nevertheless, these numbers showed assets under management by Lipper global classifications continued to be highly concentrated in the European ETF industry.
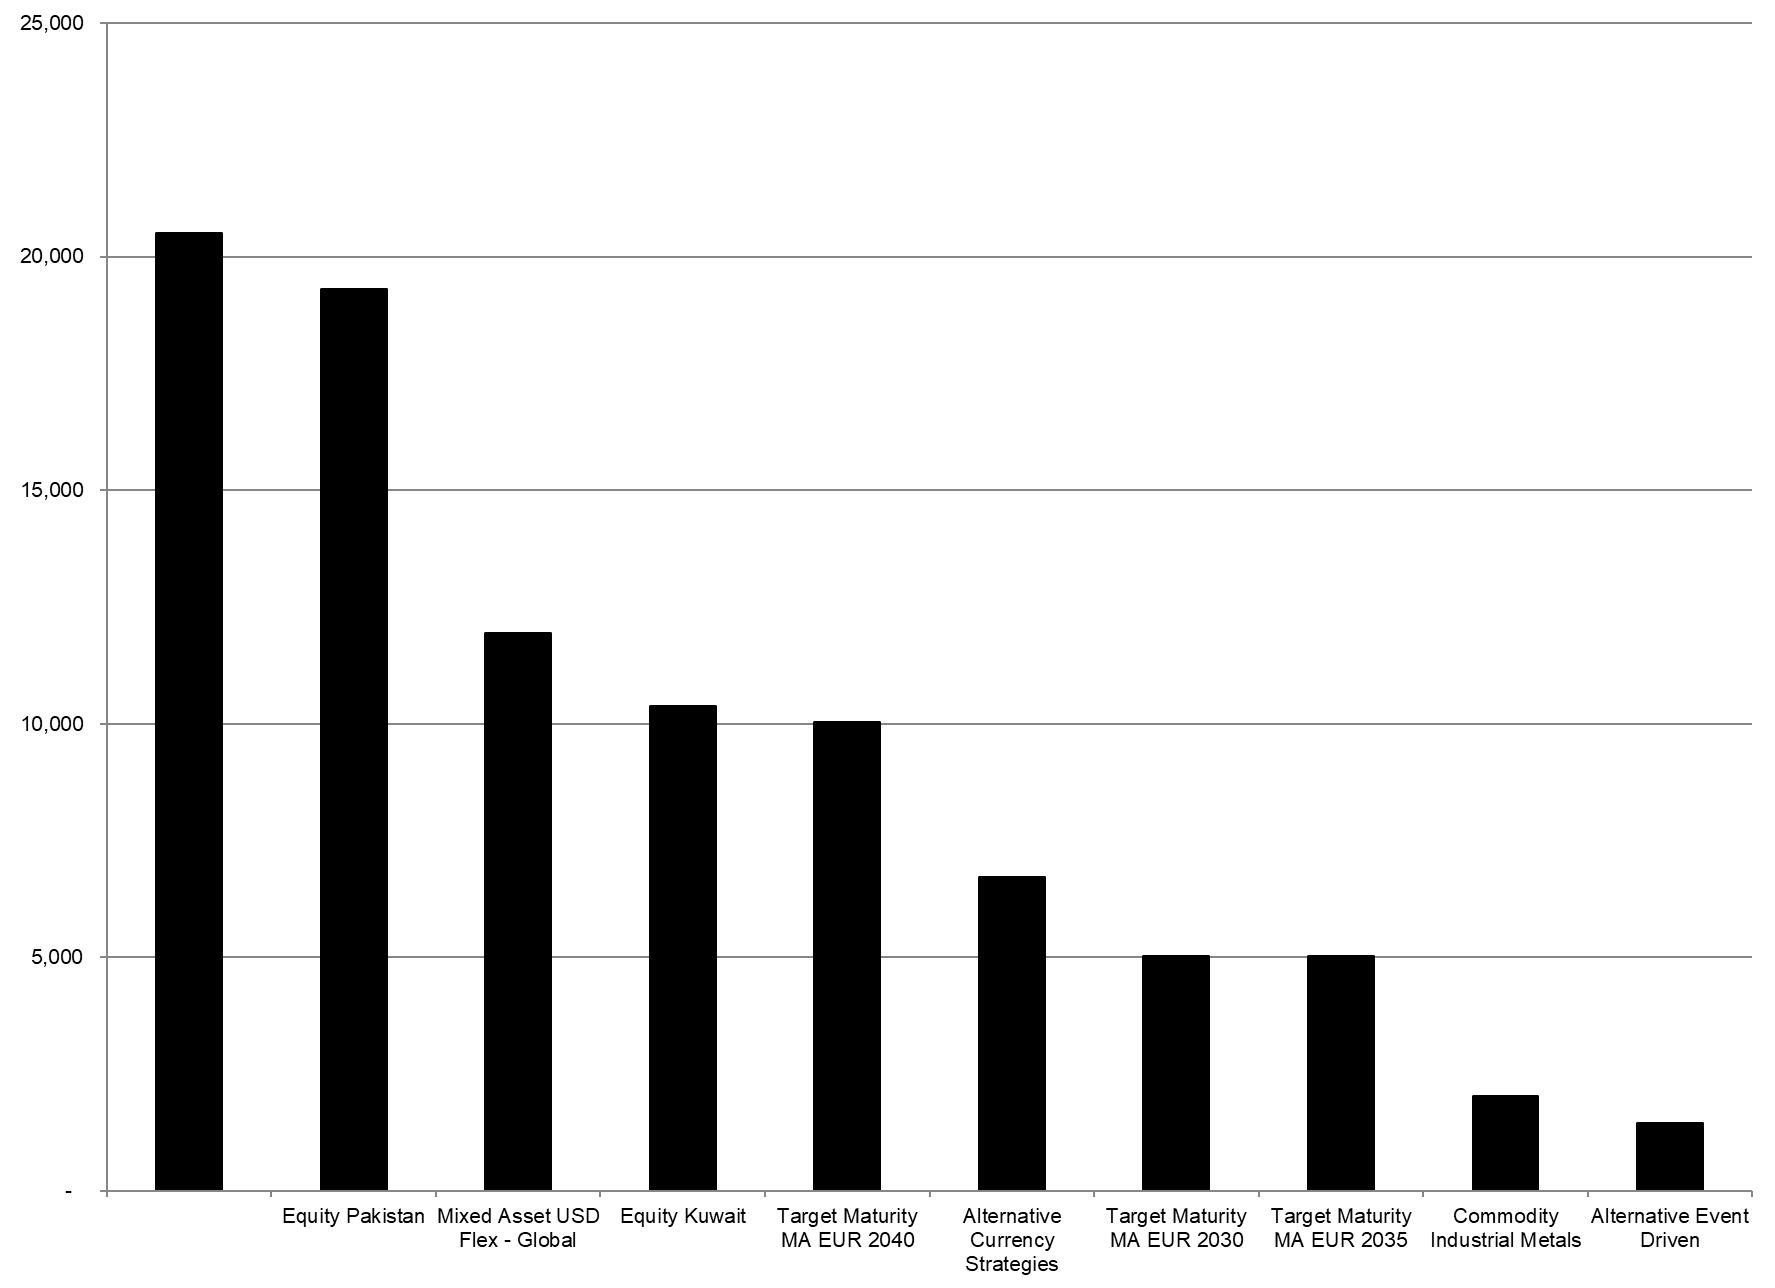
The peer groups on the other side of the table showed some funds in the European ETF market are quite low in assets and their constituents may face the risk of being closed in the near future. They are obviously lacking investor interest and might, therefore, not be profitable for their respective fund promoters (Please read our report: “Is there a consolidation ahead in the European ETF industry?” for more details on this topic).
Graph 4: Ten Smallest Lipper Global Classifications by Assets Under Management, January 30, 2025 (Euro Millions)
Source: LSEG Lipper
ETF Flows by Lipper Global Classifications
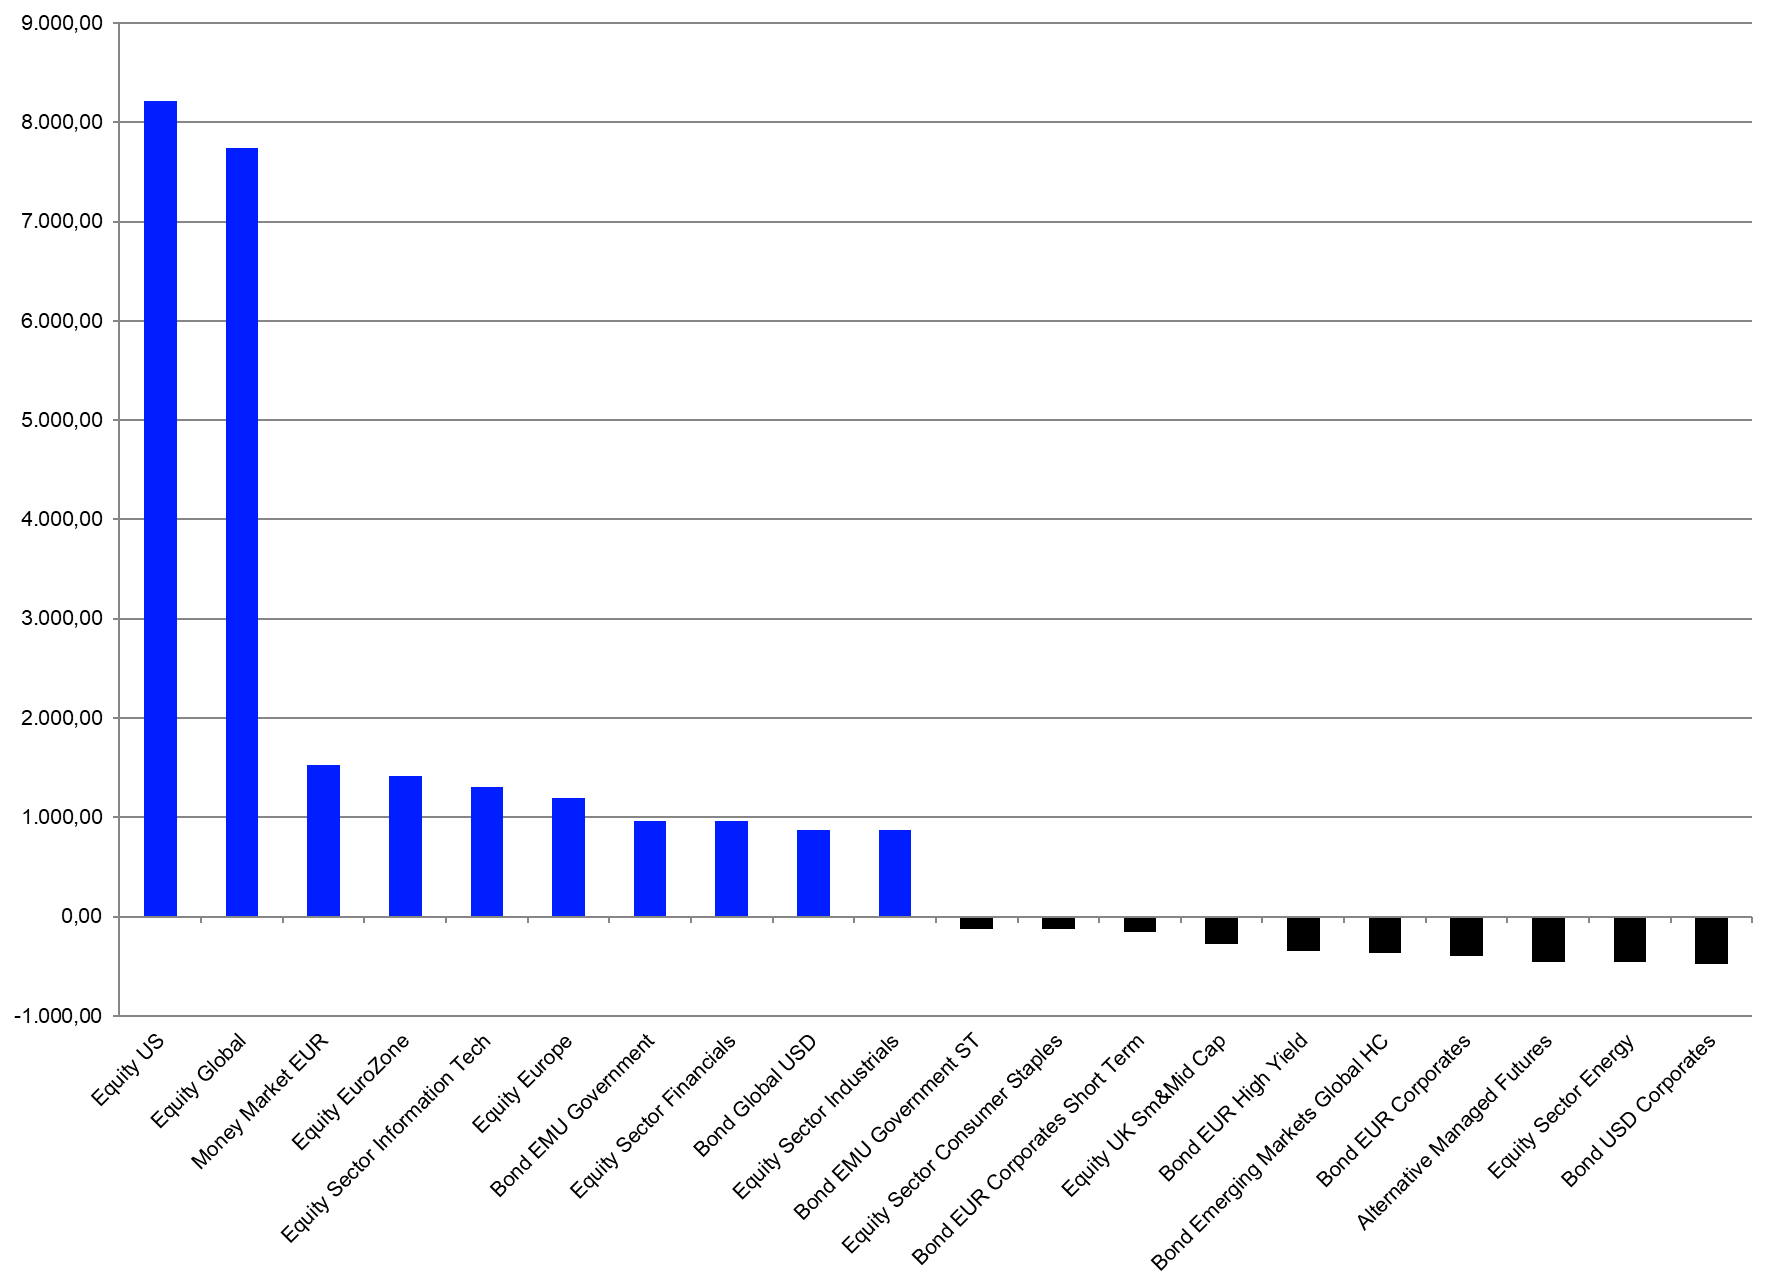
The net inflows of the 10 best-selling Lipper classifications accounted for €25.1 bn. In line with the overall sales trend for January, equity peer groups (+€21.7 bn) gathered the majority of flows by asset type on the table of the 10 best-selling peer groups by estimated net inflows. Given the overall fund flow trend in the European ETF industry, it was not surprising that Equity U.S. (+€8.2 bn) was the best-selling Lipper global classification for January. It was followed by Equity Global (+€7.7 bn) and Money Market EUR (+€1.5 bn).
The flows into money market products in the European ETF industry have somewhat further normalized over the course of January. Nevertheless, Money Market EUR (+€1.5 bn) is still on the table of the 10 best-selling Lipper classifications for the month despite the fact that money market products in general are not a core asset type within the European ETF industry. The estimated inflows in money market products may be an indicator that European investors have become cautious when it comes to their positioning on the respective yield curves and may want to take profit from the elevated interest rate level on the short end of the yield curves. On the other hand, there were much higher inflows into bond ETFs over the course of the month which do indicate that European investors are buying bonds with a longer duration. The combination of the flows in bond in money market ETF may therefore indicate that some investors may follow a barbell strategy.
More generally, these numbers showed the European ETF segment is also highly concentrated when it comes to fund flows by classification. Generally speaking, one would expect the flows into ETFs to be concentrated since investors often use ETFs to implement their market views and short-term asset allocation decisions. These products are made and, therefore, are easy to use for these purposes.
Graph 5: Ten Best- and Worst-Lipper Global Classifications by Estimated Net Sales, January 2025 (Euro Millions)
Source: LSEG Lipper
On the other side of the table, the 10 peer groups with the highest estimated net outflows for January accounted for €3.2 bn in outflows. These outflows were below the outflows for 10 peer groups with the highest outflows for December 2024 (€4.8 bn).
Bond USD Corporates (-€0.5 bn) was once again the classification with the highest outflows for the month. It was bettered by Equity Sector Energy (-€0.5 bn), Alternative Managed Futures (-€0.5 bn), Bond EUR Corporates (-€0.4 bn), and Bond Emerging Markets Global in Hard Currencies (-€0.4 bn).
Assets Under Management by Promoters
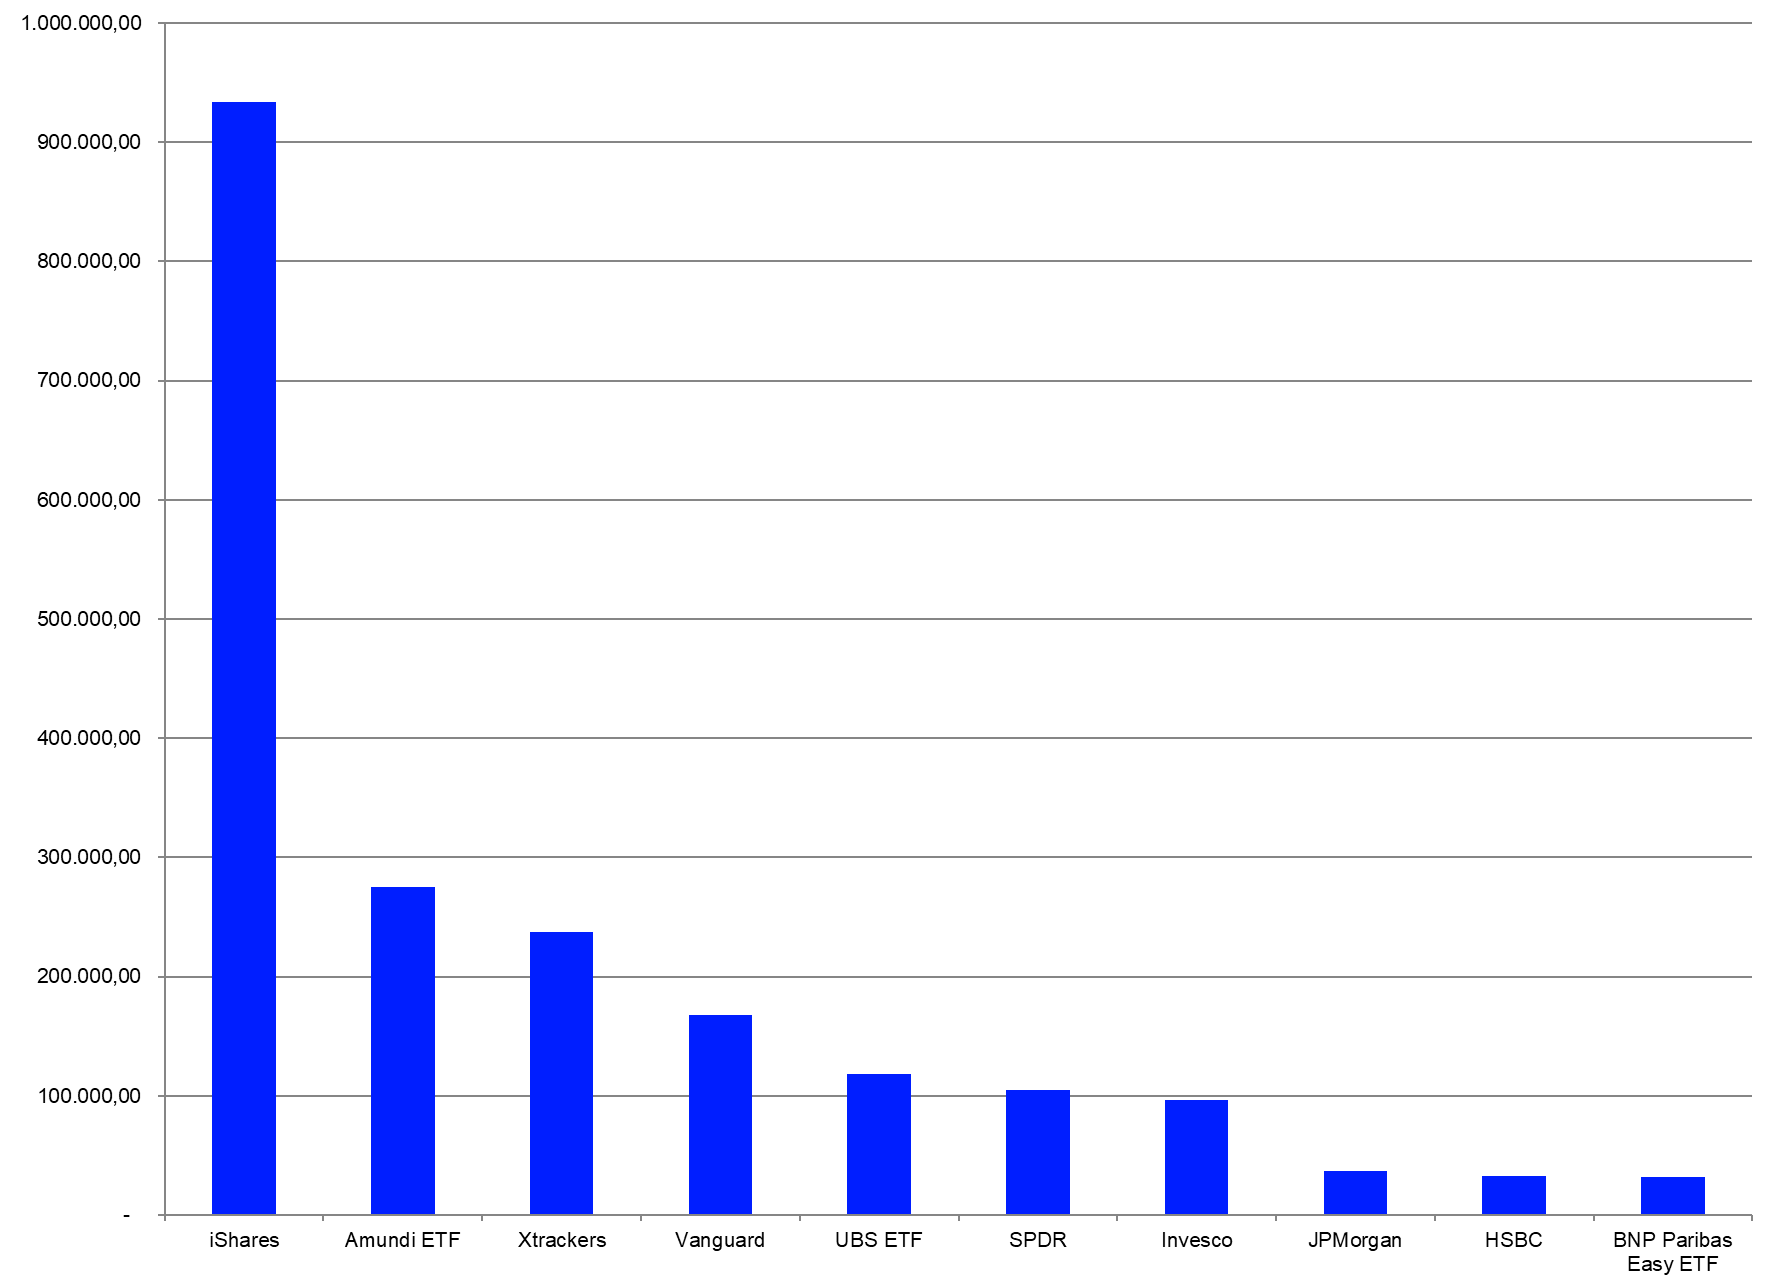
A closer look at assets under management by promoters in the European ETF industry also showed high concentration, with only 29 of the 62 ETF promoters in Europe holding assets at or above €1.0 bn. The largest ETF promoter in Europe—iShares (€933.9 bn)—accounted for 43.19% of the overall assets under management, far ahead of the number-two promoter—Amundi ETF (€275.6 bn)—and the number-three promoter—Xtrackers (€237.6 bn). (To learn more about the concentration of the European ETF market at the promoter level, please read our report: Spotlight on the concentration at the promoter level in the European ETF industry).
Graph 6: The 10 Largest ETF Promoters by Assets Under Management, January 31, 2025 (Euro Millions)
Source: LSEG Lipper
The 10-top promoters accounted for 94.20% of the overall assets under management in the European ETF industry. This meant, in turn, the other 52 fund promoters registering at least one ETF for sale in Europe accounted for only 5.80% of the overall assets under management.
ETF Flows by Promoters
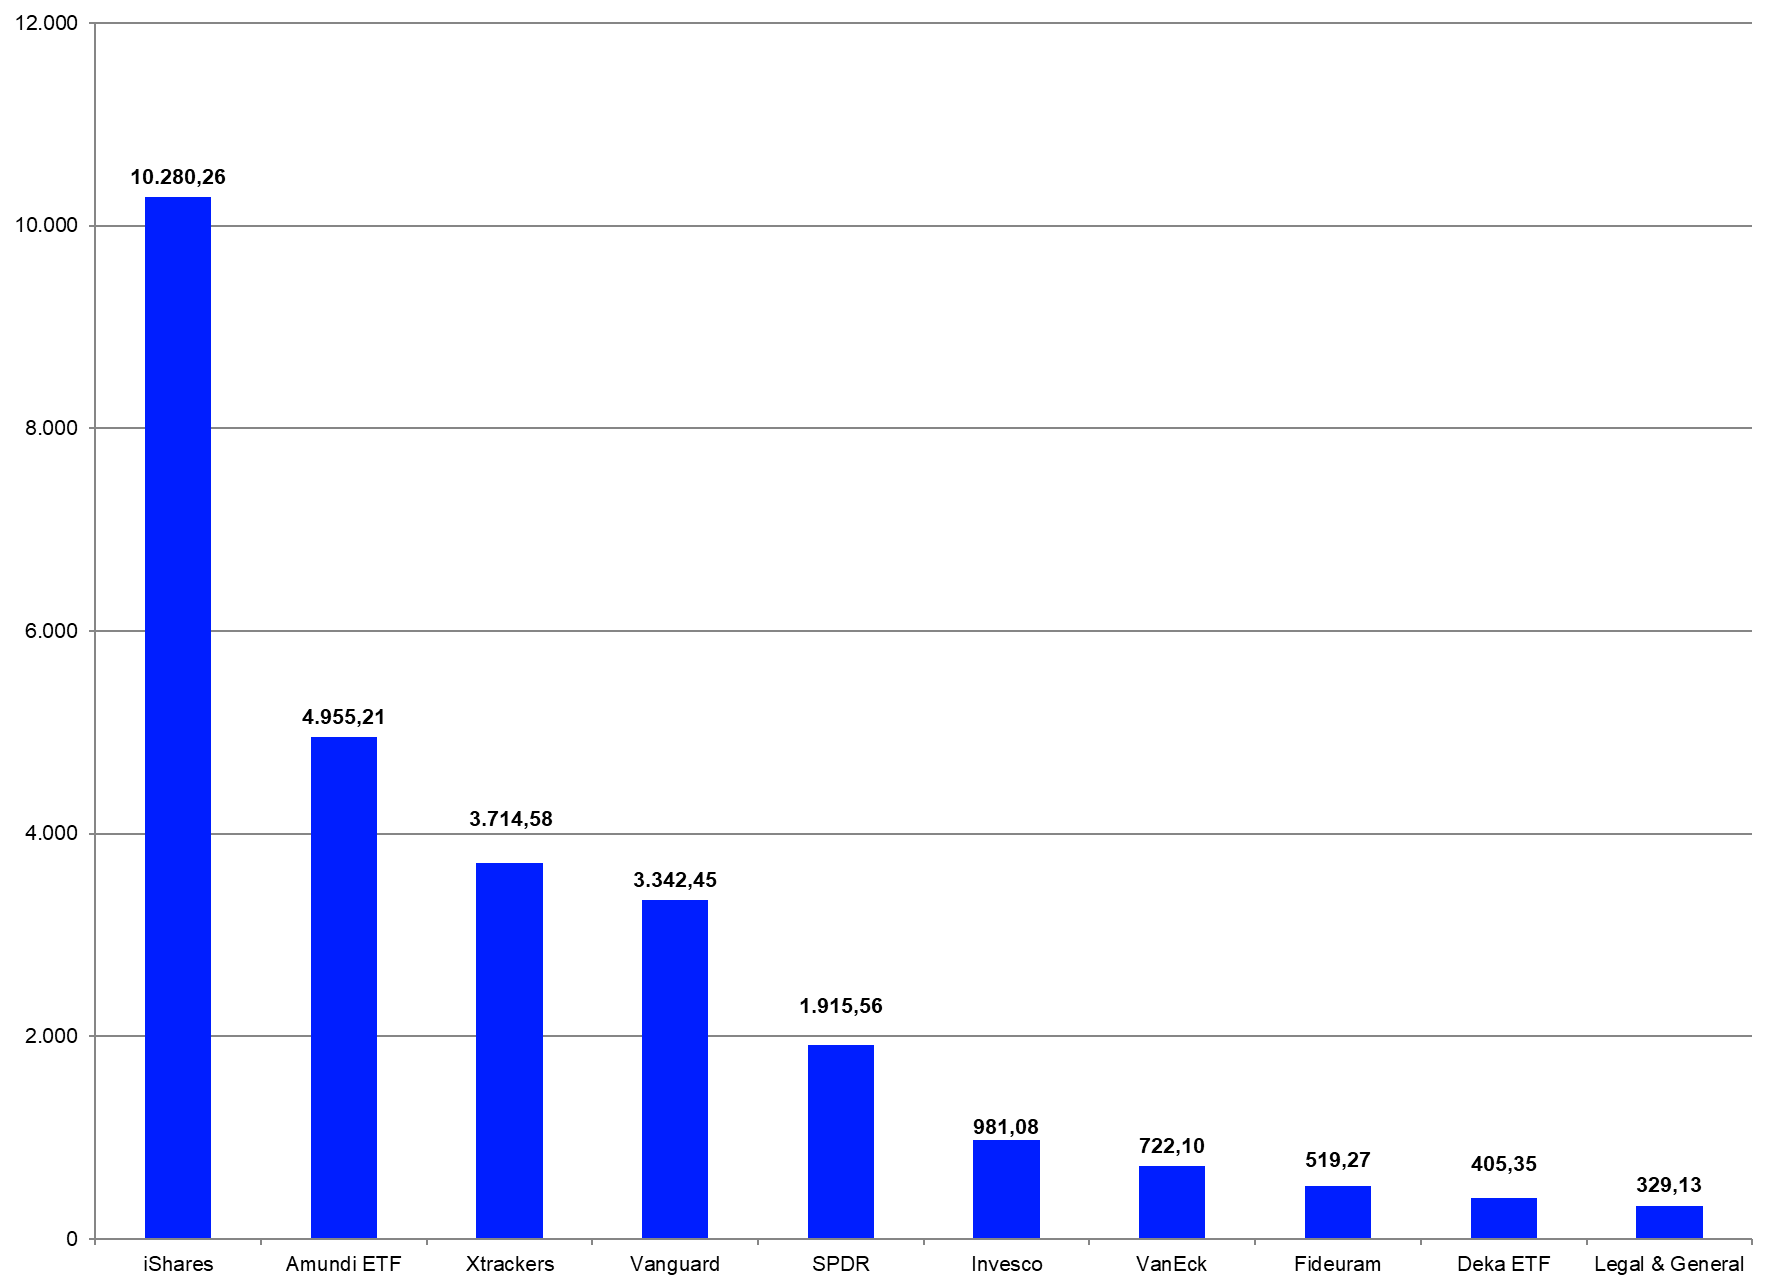
Since the European ETF market is highly concentrated with regard to the assets under management by promoter, it was not surprising that six of the 10 largest promoters by assets under management were among the 10-top selling ETF promoters for January. iShares was the best-selling ETF promoter in Europe for January (+€10.3 bn), ahead of Amundi ETF (+€5.0 bn) and Xtrackers (+€3.7 bn).
Graph 7: Ten Best-Selling ETF Promoters, January 2025 (Euro Millions)
Source: LSEG Lipper
The flows of the 10-top promoters accounted for estimated net inflows of €27.2 bn. As for the overall flow trend in January, it was clear that some of the 62 promoters (11) faced estimated net outflows (-€0.3 bn in total) over the course of the month.
Assets Under Management by ETFs
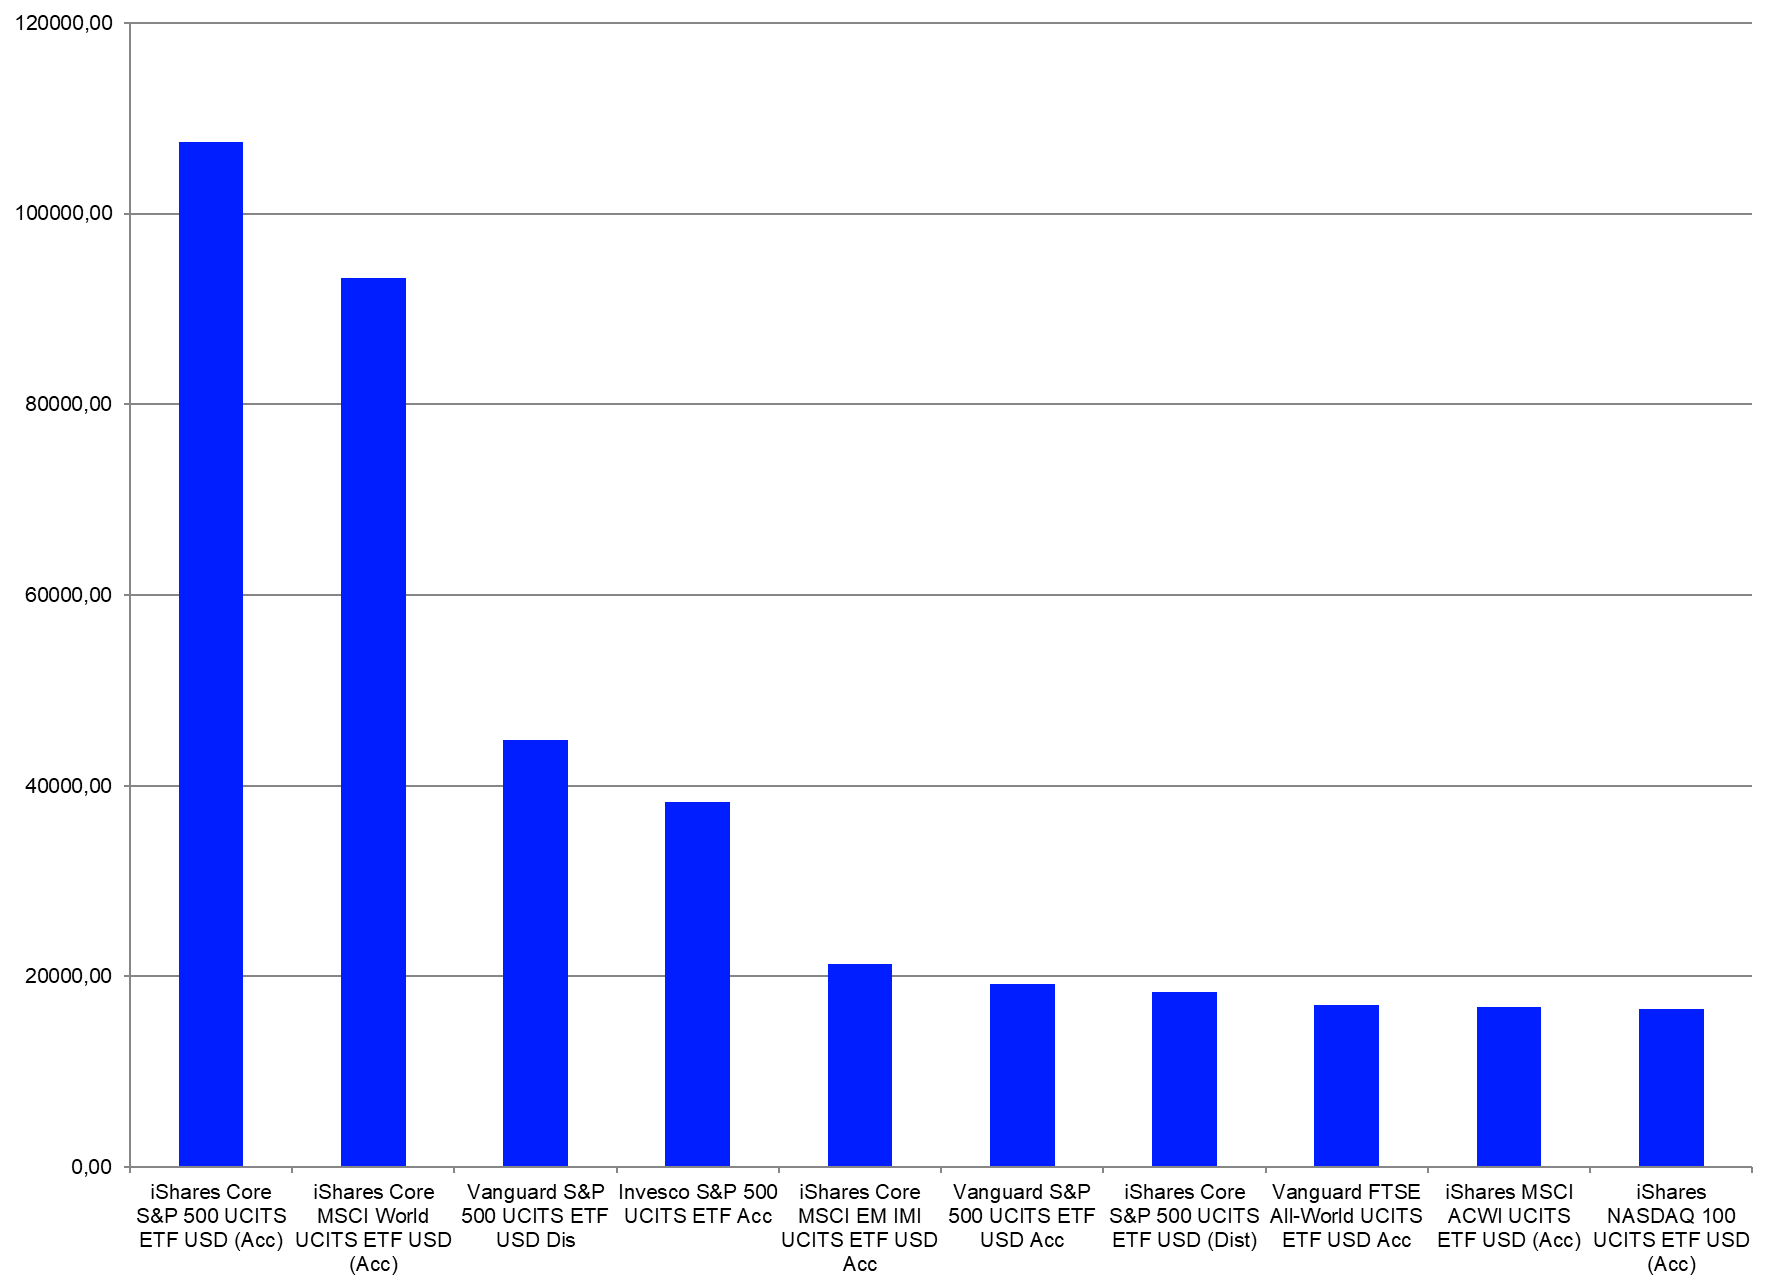
There were 4,035 instruments (primary funds [3,502] and convenience share classes [533]) listed as ETFs in the Lipper database at the end of January. Regarding the overall market pattern, it was not surprising assets under management at the ETF level were also highly concentrated. Only 434 of the 4,035 instruments held assets above €1.0 bn each. These products accounted for €1,622.5 bn, or 75.04%, of the overall assets in the European ETF industry. The 10 largest ETFs in Europe accounted for €393.1 bn, or 18.18%, of the overall assets under management. (Please read our study: Is the European ETF industry dominated by only a few funds? to learn more about the concentration at the single-fund level in the European ETF industry).
Graph 8: The 10 Largest ETFs by Assets Under Management, January 31, 2025 (Euro Millions)
Source: LSEG Lipper
ETF Flows at Share Class Level
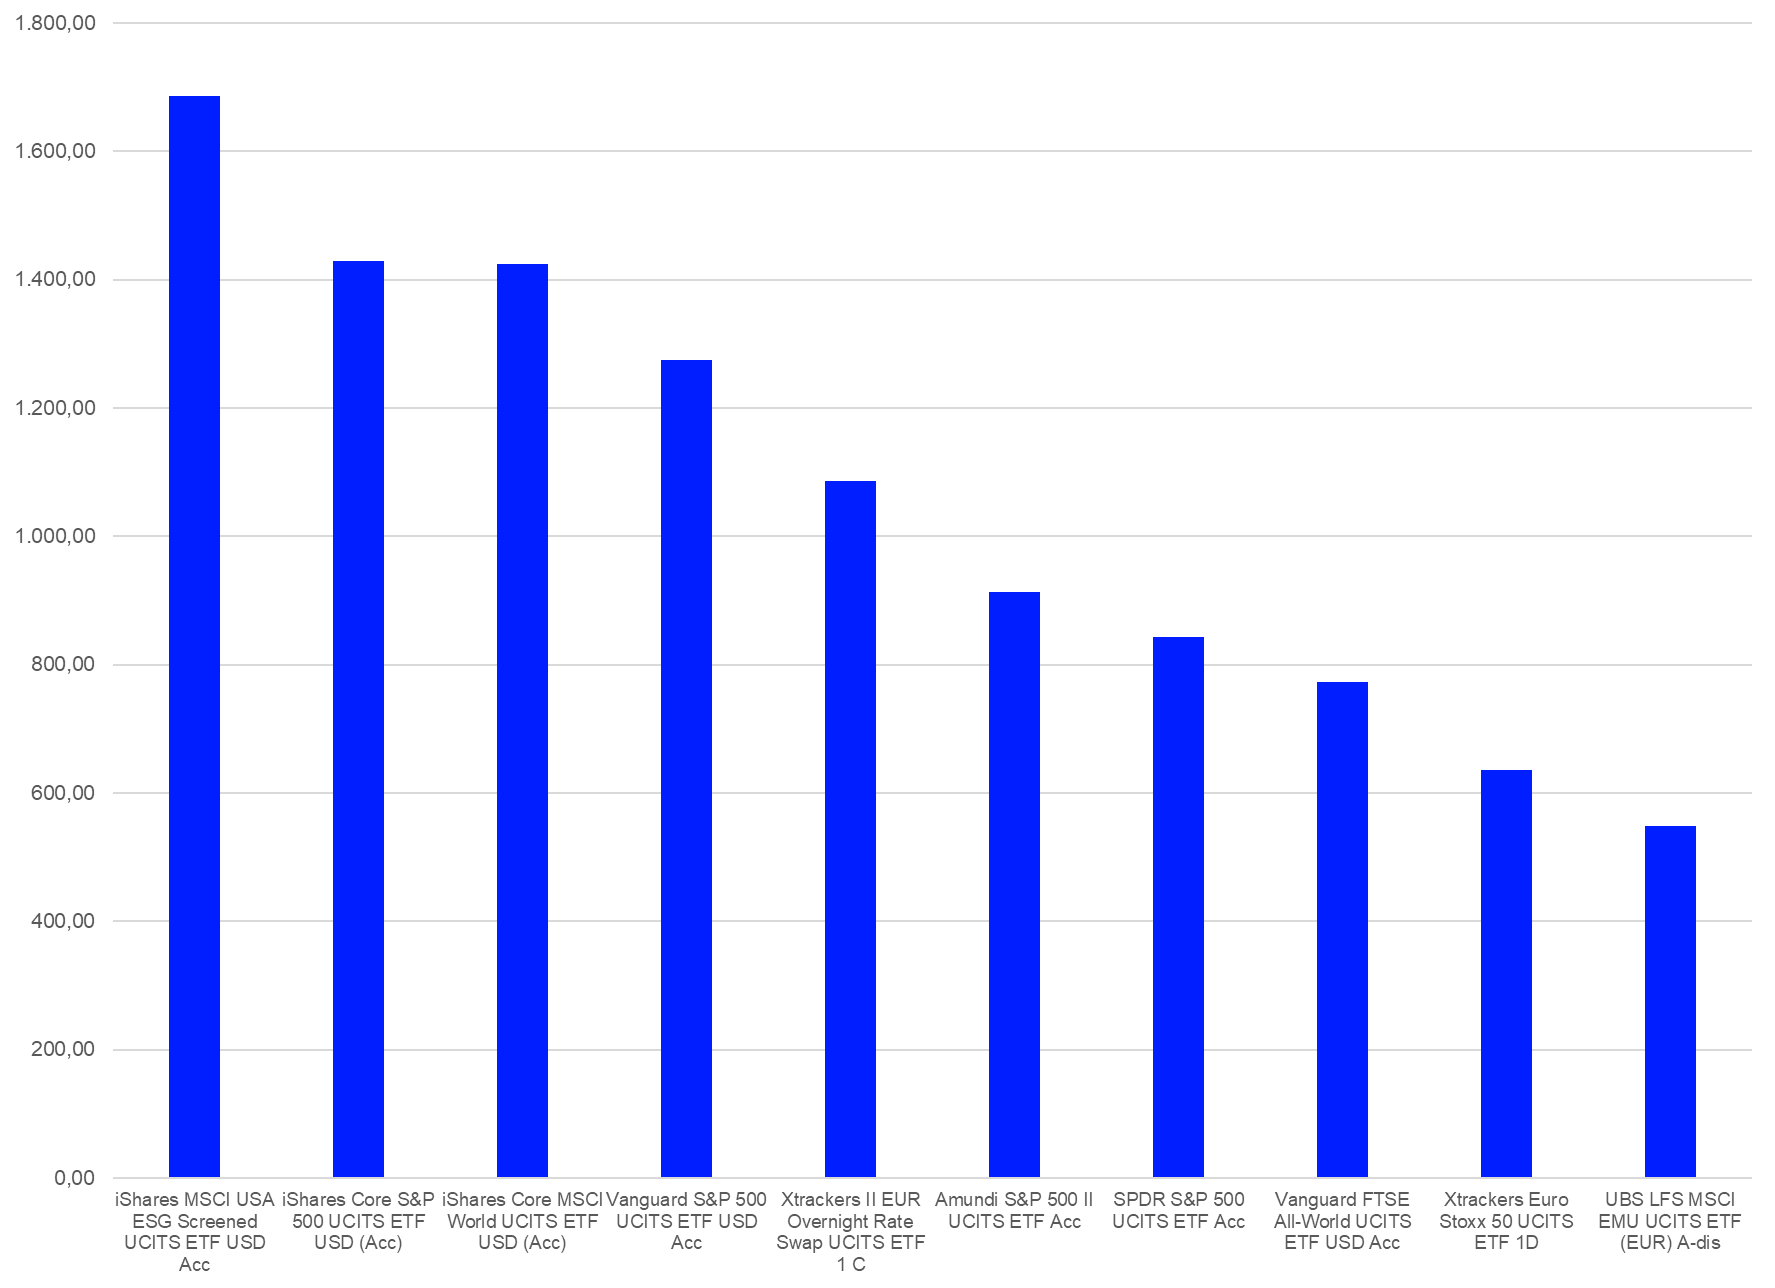
A total of 1,818 of the 4,035 instruments analyzed in this report showed net inflows of more than €10,000 each for January, accounting for inflows of €51.7 bn. This meant the other 2,217 instruments faced no flows, or net outflows, for the month (When looking at this statistic, one needs to bear in mind that some of these instruments are convenience share classes that do not report assets under management. This means Lipper can’t calculate fund flows for these ETFs). Upon closer inspection, only 105 of the 1,818 ETFs posting net inflows enjoyed inflows of more than €100 m during January—for a total of €30.0 bn. The best-selling ETF for January was iShares MSCI USA ESG Screened UCITS ETF USD Acc, which enjoyed estimated net inflows of €1.7 bn. It was followed by iShares Core S&P 500 UCITS ETF USD (Acc) (+€1.4 bn) and iShares Core MSCI World UCITS ETF USD (Acc) (+€1.4 bn).
Graph 9: The 10 Best-Selling ETFs, January 2025 (Euro Millions)
Source: LSEG Lipper
The flow pattern at the fund level indicated there was a lot of turnover and rotation during January, but it also showed the concentration of the European ETF industry even better than the statistics at the promoter or classification levels since the 10 best-selling ETFs account for inflows of €10.6 bn.
Given its size and the overall trend for net sales at the promoter level, it was surprising that only three of the 10 best-selling funds for January were promoted by iShares. These iShares ETFs accounted for estimated net inflows of €4.5 bn.
This article is for information purposes only and does not constitute any investment advice.
The views expressed are the views of the author, not necessarily those of LSEG.

