While U.S. equity markets appear to have gotten their second wind, hitting a new round of record highs during the Refinitiv Lipper fund-flows week ended March 10, 2021—excluding the NASDAQ, which entered correction territory, ETF and mutual fund investors appear to be very selective in their purchasing choices.
Year to date, through the most recent fund-flows week, investors have injected a net $254.9 billion into conventional funds and ETFs. The primary attractor of investors’ assets, despite a steepening of the Treasury yield curve, continues to be taxable bond funds (+$107.4 billion), followed by money market funds (+$76.9 billion), equity funds (+$46.2 billion), and municipal bond funds (+$24.3 billion).
Even though corporate investment-grade debt funds (+$98.0 billion) remain a primary attractor of net new money year to date, we continue to see a growing interest in other sectors in this space, with flexible funds taking in $18.3 billion, government-Treasury funds drawing in $13.0 billion, and government-mortgage funds attracting $5.4 billion. Risky bond assets continued to be ignored, with international & global debt funds (-$18.4 billion) suffering the largest net redemptions, bettered by corporate high-yield funds (-$9.4 billion).
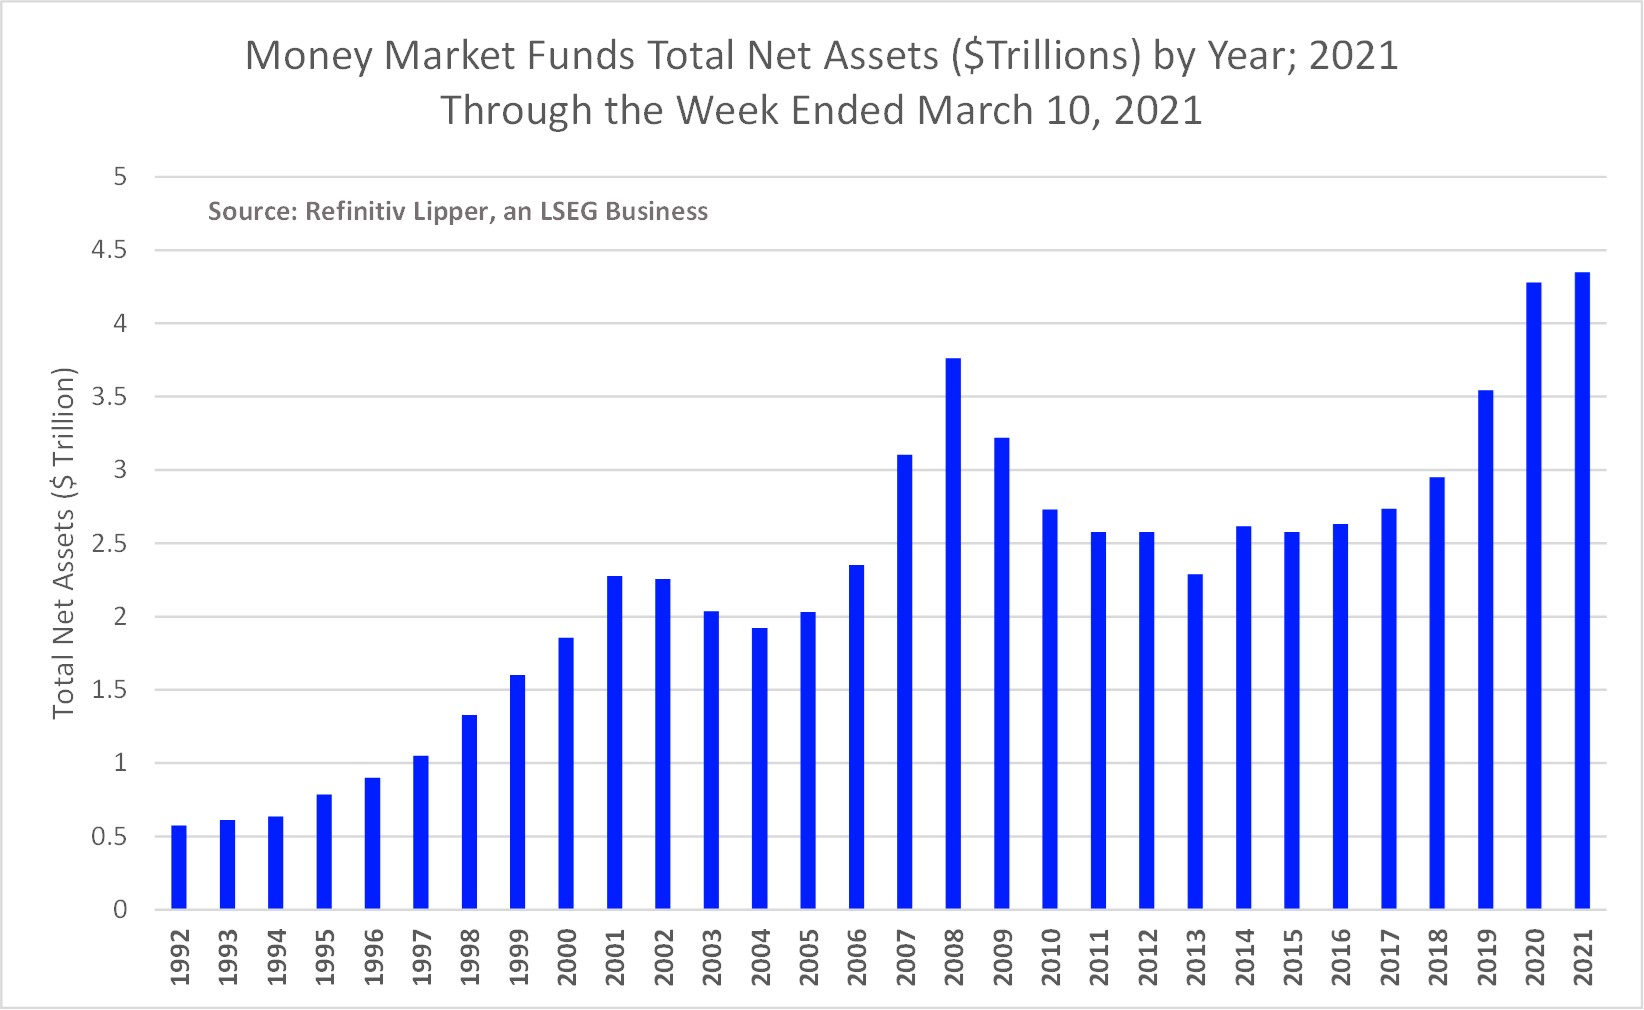
Every time I point out that a lot of money continues to sit on the sidelines, I hear back from readers that say there is no such thing as the sidelines. However, with money markets (+$76.9 billion) attracting the second largest amount of net new money year to date it’s hard to argue against the idea there does appear to be an excess of pent up demand still waiting to be put back work. Total net assets in money market funds have leapt to $4.3 trillion, their largest sum on record.
For the equity universe, flows into cyclical issues continued. During the most recent flows week, equity funds (including ETFs) attracted some $14.8 billion, with international equity funds (+$4.6 billion) taking in the largest amount of net month, followed by small-cap funds (+$3.7 billion), large-cap funds (+$3.9 billion), sector energy funds (+$1.5 billion), and sector-financial/banking (+$1.1 billion).
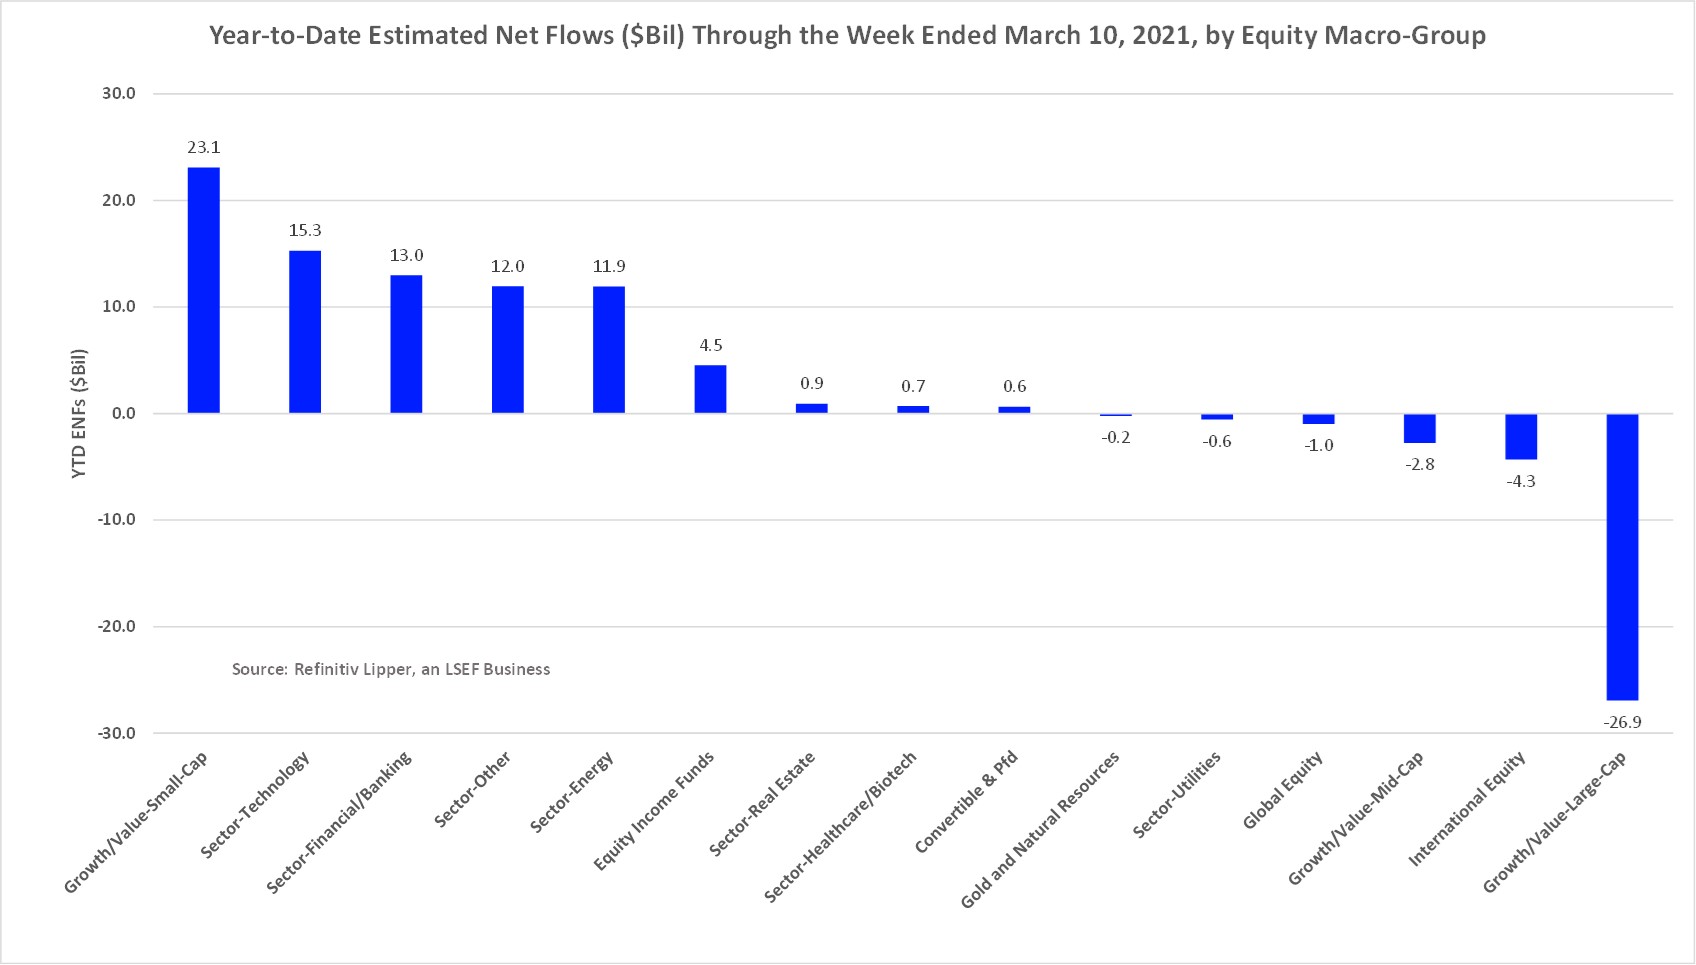
Year to date, equity funds (including ETFs) have attracted some $46.2 billion, with small-cap funds (+$23.1 billion) drawing in the largest sums of net new money, followed by sector-technology funds (+$15.3 billion) which are still benefitting from the recent tech rally, and then by some of the more cyclically-oriented sectors: sector-financial/banking funds (+$13.0 billion, benefitting from the steepening of the yield curve), sector-energy funds (+$11.9 billion, rallying behind the sharp rises in near-month oil future prices), and the commodities-heavy sector-other funds (+$11.9 billion). Not surprising considering the recent rotation out of some of the highflying tech and stay-at-home issues, large-cap funds have suffered the largest net redemptions, handing back $26.9 billion so far in 2021.
While investors continue to be net redeemers of equity mutual funds, withdrawing $81.8 billion year to date, equity ETFs remained the primary attractor, taking in $128.0 billion so far this year. However, on the fixed income side of the equation, actively managed funds are still outdrawing their passively managed counterparts, with taxable bond funds taking in $84.3 billion year to date, while their ETF brethren took in just $23.2 billion. The same trend applies to municipal funds, where actively managed funds took in $20.3 billion, while municipal bond ETFs took in $4.0 billion so far.


