The Japanese yen has experienced a drastic weakening in the last few months, reaching its lowest level against the dollar in 24 years with a 25% loss in value in the year to date, a trend which is becoming increasingly concerning for Japan.

Refresh this chart in your browser | Edit the chart in Datastream
On the face of it, this is an unusual development. In a risk-off environment, when equities are falling, the Japanese yen tends to strengthen. There is, in other words, a negative correlation between equity price changes and the change in the value of the Japanese yen against a broad basket of currencies, as our chart shows. So what is driving the yen down? As ever, the answer lies in not one but a number of factors.

Refresh this chart in your browser | Edit the chart in Datastream
Want more charts and analysis? Access a pre-built library of charts built by Fathom Consulting via Datastream Chartbook in Refinitiv Eikon.
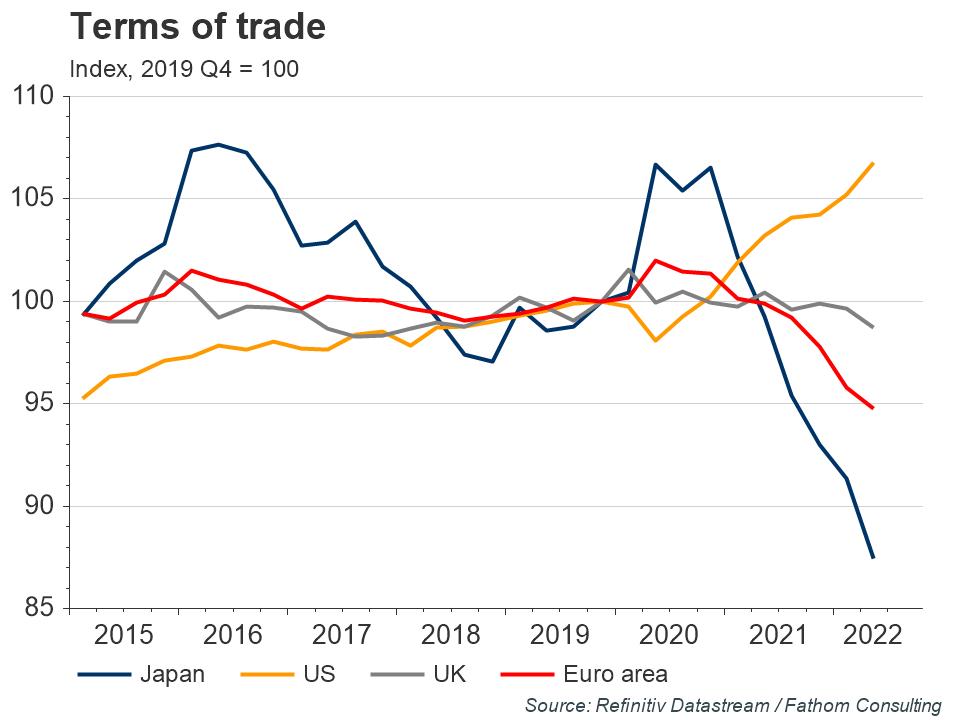
The sharp rise in energy prices has probably been an important driver of recent weakness. Japan is a substantial net importer of energy: in 2021, its net energy imports amounted to 2.91% of GDP. Equivalent figures for the euro area and the UK were 2.13% and 1.10% respectively. The US, by contrast, is a net exporter of energy. Recent movements in energy prices are reflected in the terms of trade for these countries, with Japan’s terms of trade deteriorating substantially since the pandemic, indicating that it has become worse off as a nation.
Refresh this chart in your browser | Edit the chart in Datastream
Countries that have seen a deterioration in their terms of trade tend to see the value of their currencies fall, which ultimately strengthens global demand for what they produce and thereby restores balance.
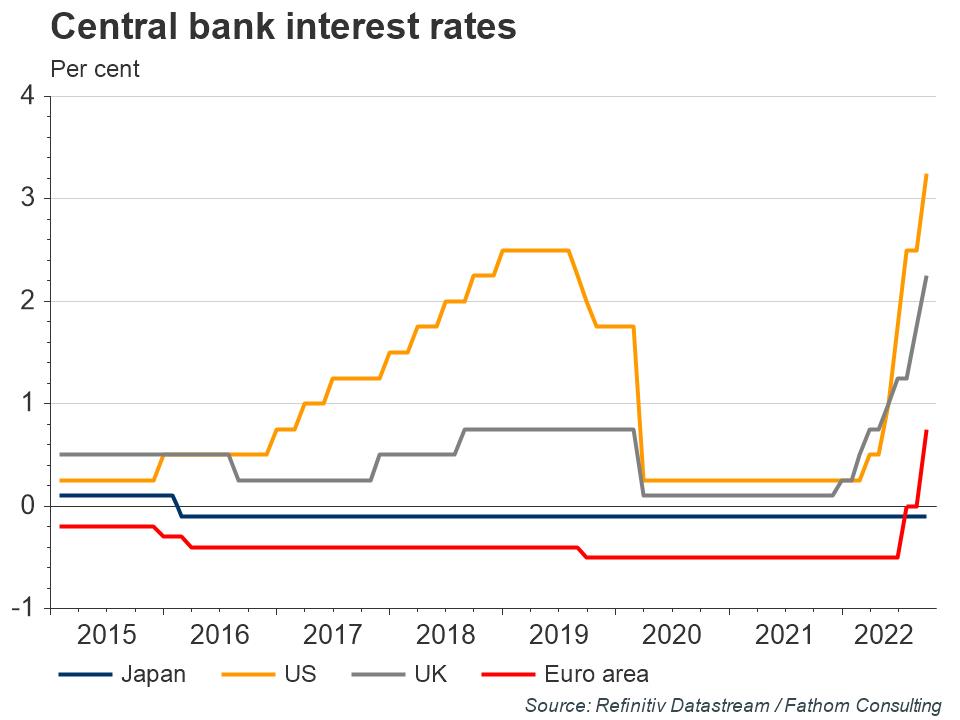
Another major cause of the recent fall in the value of the yen is the discrepancy between Japan’s monetary policy and that of many other advanced economies; central banks such as the Fed, ECB and the Bank of England have begun aggressive rate hikes in response to rising inflation, whereas the Bank of Japan has chosen to keep its negative rates stable. News of more rate increases from major central banks around the world this week further solidified this trend.
Refresh this chart in your browser | Edit the chart in Datastream
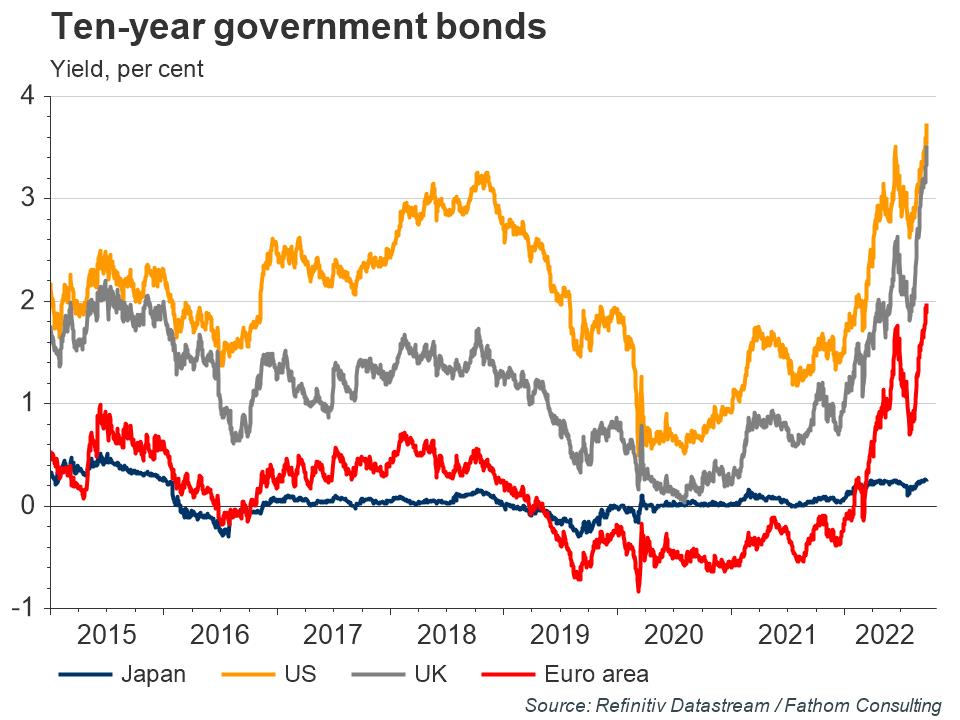
These contrasting monetary policy stances have created a widening yield spread between Japan and other advanced economies, driving investors away from Japan and weakening demand for the yen. The yields on Japanese ten-year government bonds have been low for years as a result of the Bank of Japan’s yield curve control policy.
Refresh this chart in your browser | Edit the chart in Datastream
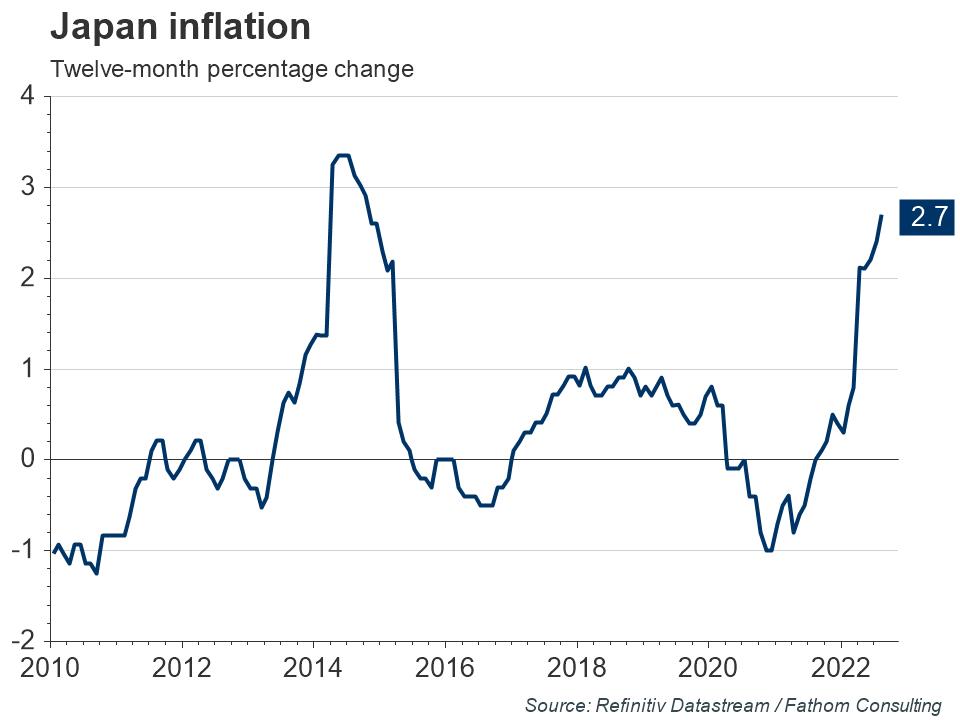
The Bank of Japan has reiterated that it will not change its policy stance anytime soon, as inflation has not risen as much in Japan as in other advanced economies, and the Japanese economy is experiencing a slowdown in growth. Rising commodity prices, the effects of the COVID-19 pandemic and weak demand, coupled with an ageing population, put downwards pressure on the Japanese economy; and tackling this is something the central bank is currently choosing to prioritise.
Refresh this chart in your browser | Edit the chart in Datastream
In an attempt to boost the value of the yen, the Bank of Japan intervened in the currency market on Thursday for the first time since 1998. This announcement came following the fifth consecutive rate hike from the Fed this year, while the Bank of Japan maintained its loose stance. The BoJ’s intervention caused a slight uptick in the value of the yen, although it is unlikely to be sufficient to reverse the current trend. For the decline of the yen to be halted, global energy prices would need to fall more rapidly, and a slowdown would be required in the speed at which monetary policy is currently being tightened globally.
The views expressed in this article are the views of the author, not necessarily those of Refinitiv Lipper or LSEG.
Join a growing community of asset managers and stay up to date with the latest research from Refinitiv and partners to help you inform your investment decisions. Follow our Asset Management LinkedIn showcase page.
_________________________________________________________________
Refinitiv Datastream
Financial time series database which allows you to identify and examine trends, generate and test ideas and develop view points on the market.
Refinitiv offers the world’s most comprehensive historical database for numerical macroeconomic and cross-asset financial data which started in the 1950s and has grown into an indispensable resource for financial professionals. Find out more.

