European investors were generally in a risk-on mode over the course of the year 2021 despite the increased volatility in securities markets. Given the general market environment it was no surprise that we witness some months with mixed results for the flows within the different asset types, even as the European fund industry enjoyed inflows over the course of the first nine months of 2021. In more detail, the promoters of mutual funds enjoyed inflows of €337.0 bn. In line with this, the promoters of ETFs enjoyed record inflows of €126.9 bn over the course of the year so far. The overall flow pattern in Europe showed that investors are in risk-on mode as money market products were the only asset type with outflows year to date. In more detail, investors bought further into risky assets as long-term funds (+€557.0 bn) enjoyed inflows, while money market products (-€93.1 bn) faced high estimated net inflows. That said, the outflows from money market products needs to be seen in conjunction with the high inflows into these products over the course of 2020. In line with this, Equity Global (+€134.7 bn) was the best-selling Lipper Global Classification for the first nine months of 2021.
Assets Under Management in the European Fund Industry
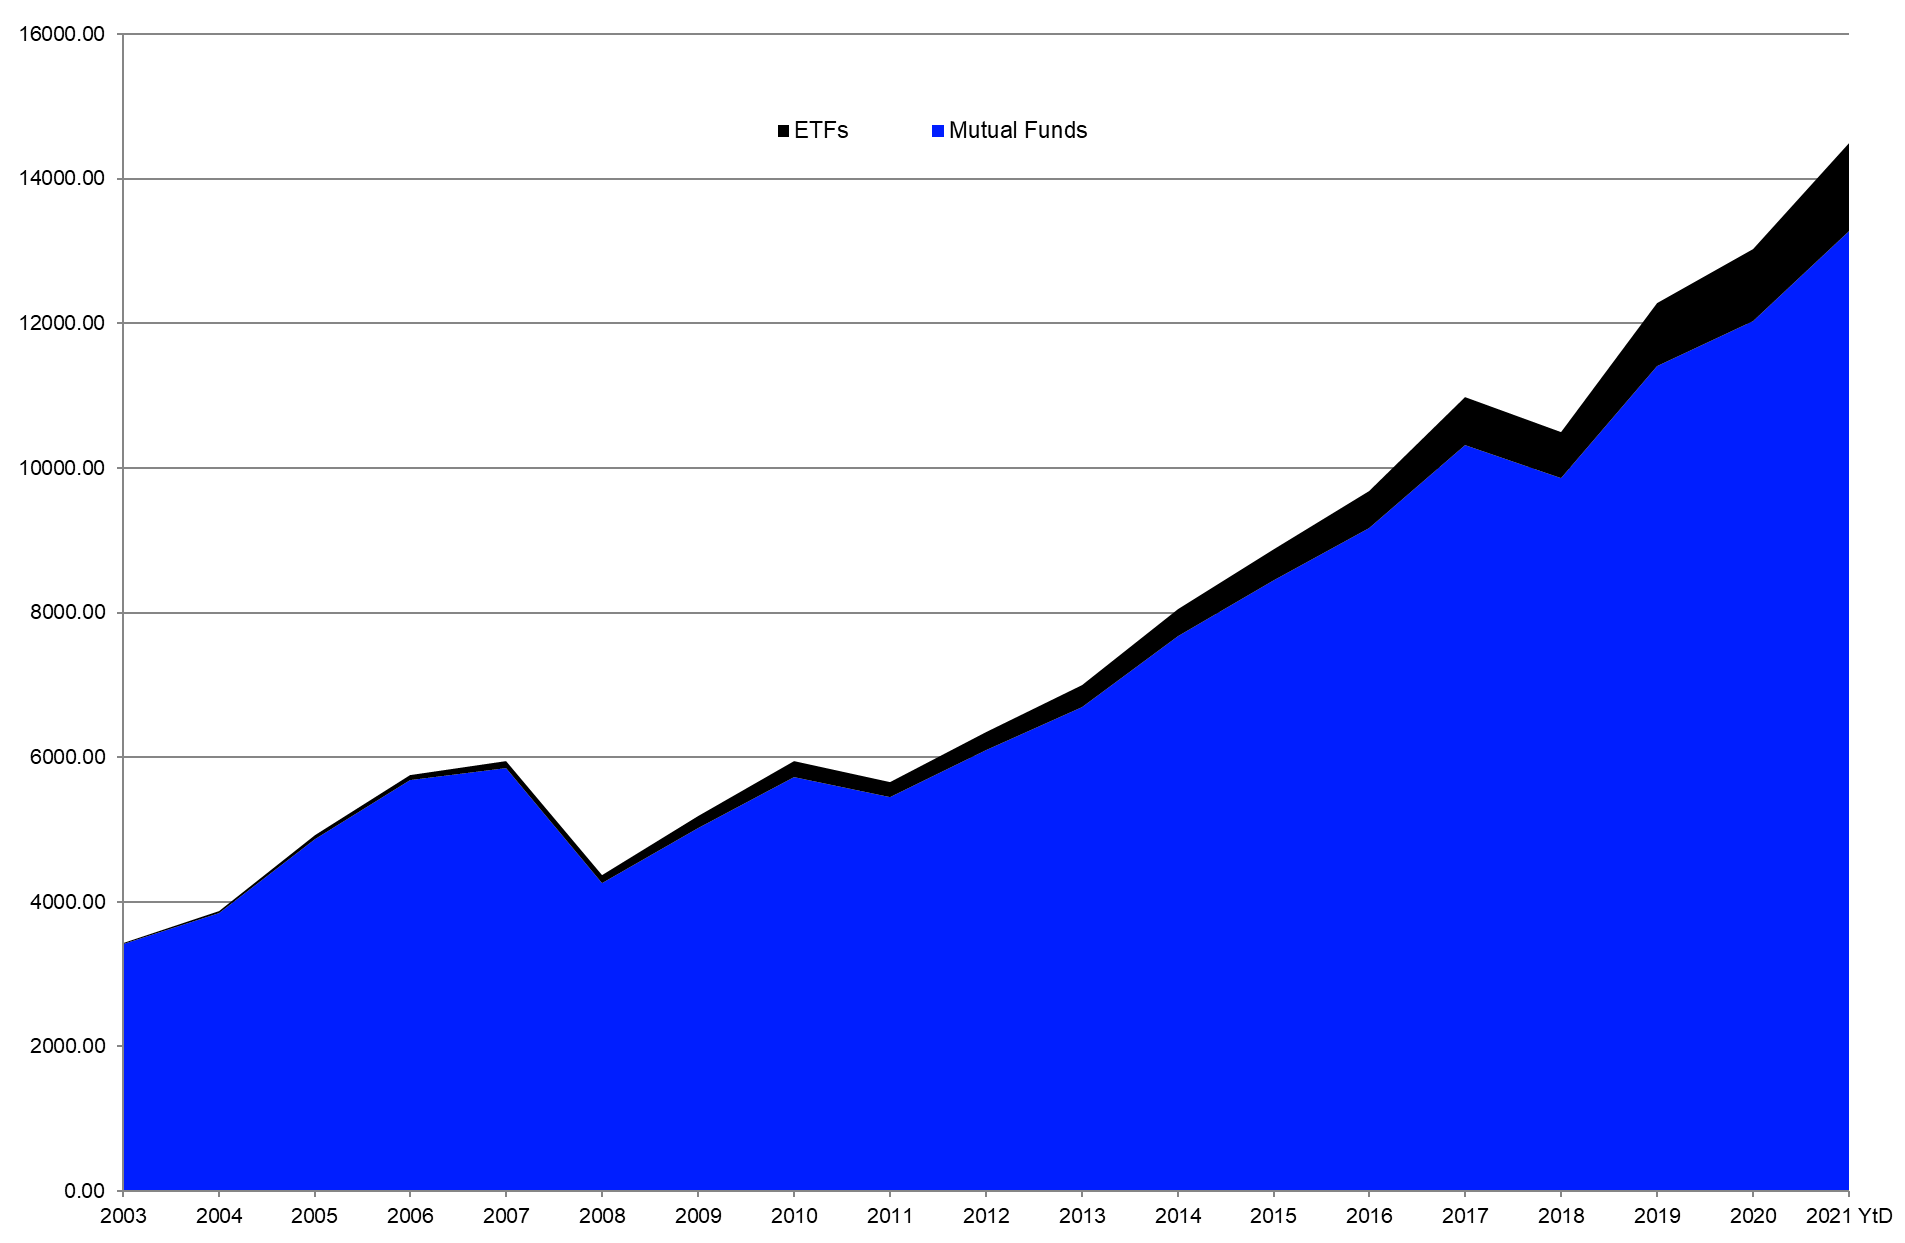
Within this environment the assets under management in the European fund industry rose from €13.0 tr (as of December 31, 2020) to €14.5 tr at the end of Q3 2021. While ETFs held €1.2 tr, or 8.41% of the assets under management in Europe, the vast majority (€13.3 tr, or 91.59%), were held by mutual funds.
Graph 1: Assets Under Management by Product Type (Euro Millions)
Source: Refinitiv Lipper
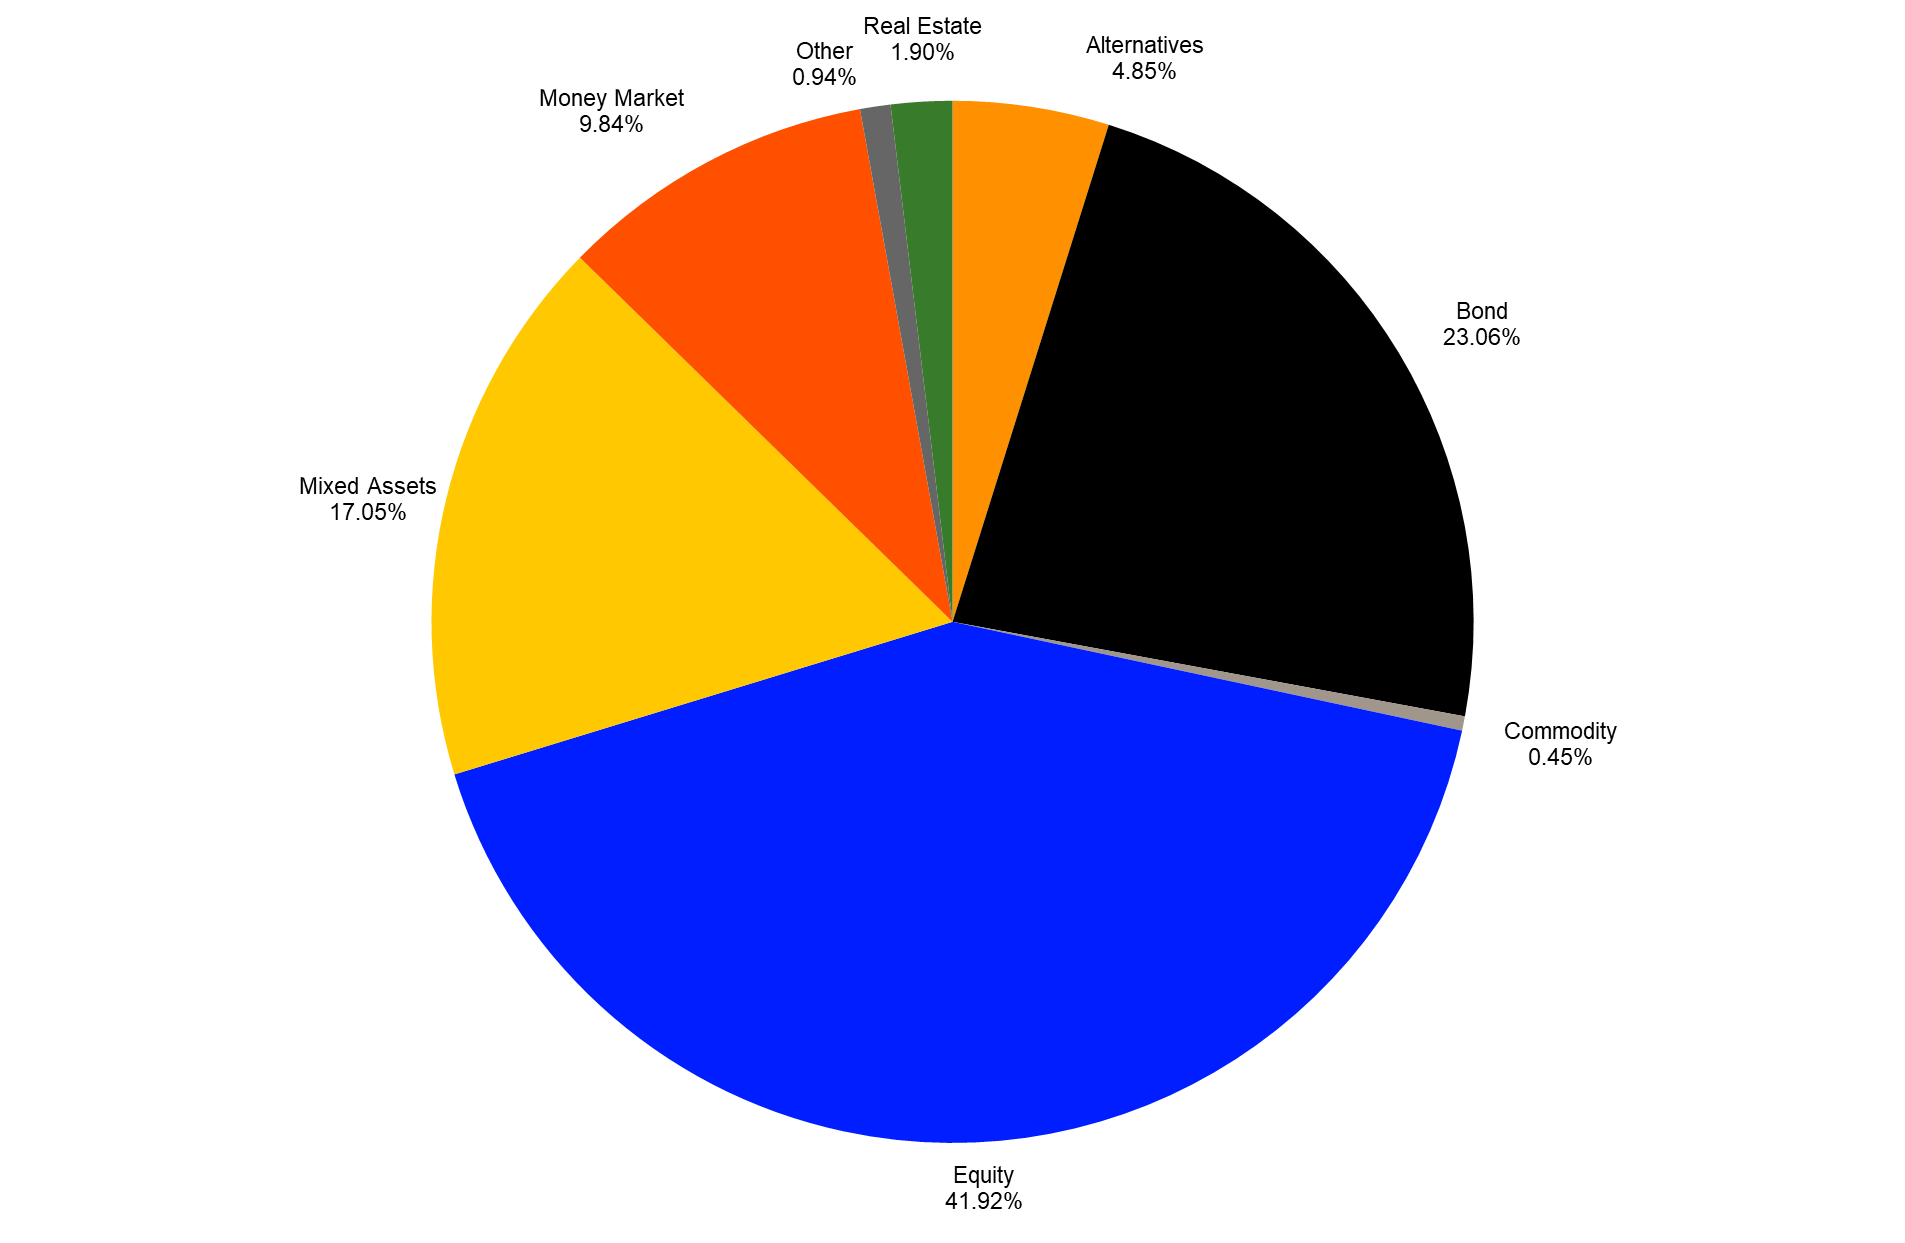
The majority of assets were held by equity funds (€6.1 tr) followed by bond funds (€3.3 tr), mixed-assets funds (€2.5 tr), money market funds (€1.4 tr), alternative UCITS funds (€0.7 tr), real estate funds (€0.3 tr), “other” funds (€0.1 tr), and commodities funds (€0.1 tr).
Graph 2: Market Share Assets Under Management by Asset Type (September 30, 2021)
Source: Refinitiv Lipper
European Fund Flow Trends Year to Date
The European fund industry enjoyed estimated overall net inflows of €463.9 bn year to date. The majority of these flows (+€337.0 bn) were invested into mutual funds, while ETFs enjoyed inflows of €126.9 bn over the course of the first nine months of 2021. Despite the fact that the majority of the flows for the first nine months of 2021 were invested into mutual funds, ETFs are on the way to reach record inflows in 2021 as the inflows already topped the all-time high for annual flows into ETFs in Europe from 2019, which stood at €106.7 bn.
The outflows from money market products over the course of September caused a negative picture for the month, as these outflows drove the overall flow numbers for September 2021 into negative territory. As a result, September marked the first month with overall outflows from mutual funds over the course of 2021.
In more detail, money market funds (-€93.1 bn) show overall outflows for the year so far, while long-term investment products enjoyed estimated inflows of €557.0 bn. The overall outflows from money market products for the year so far need to be seen in the context of the massive inflows into these products over the course of 2020, which haven’t been offset by the outflows so far.
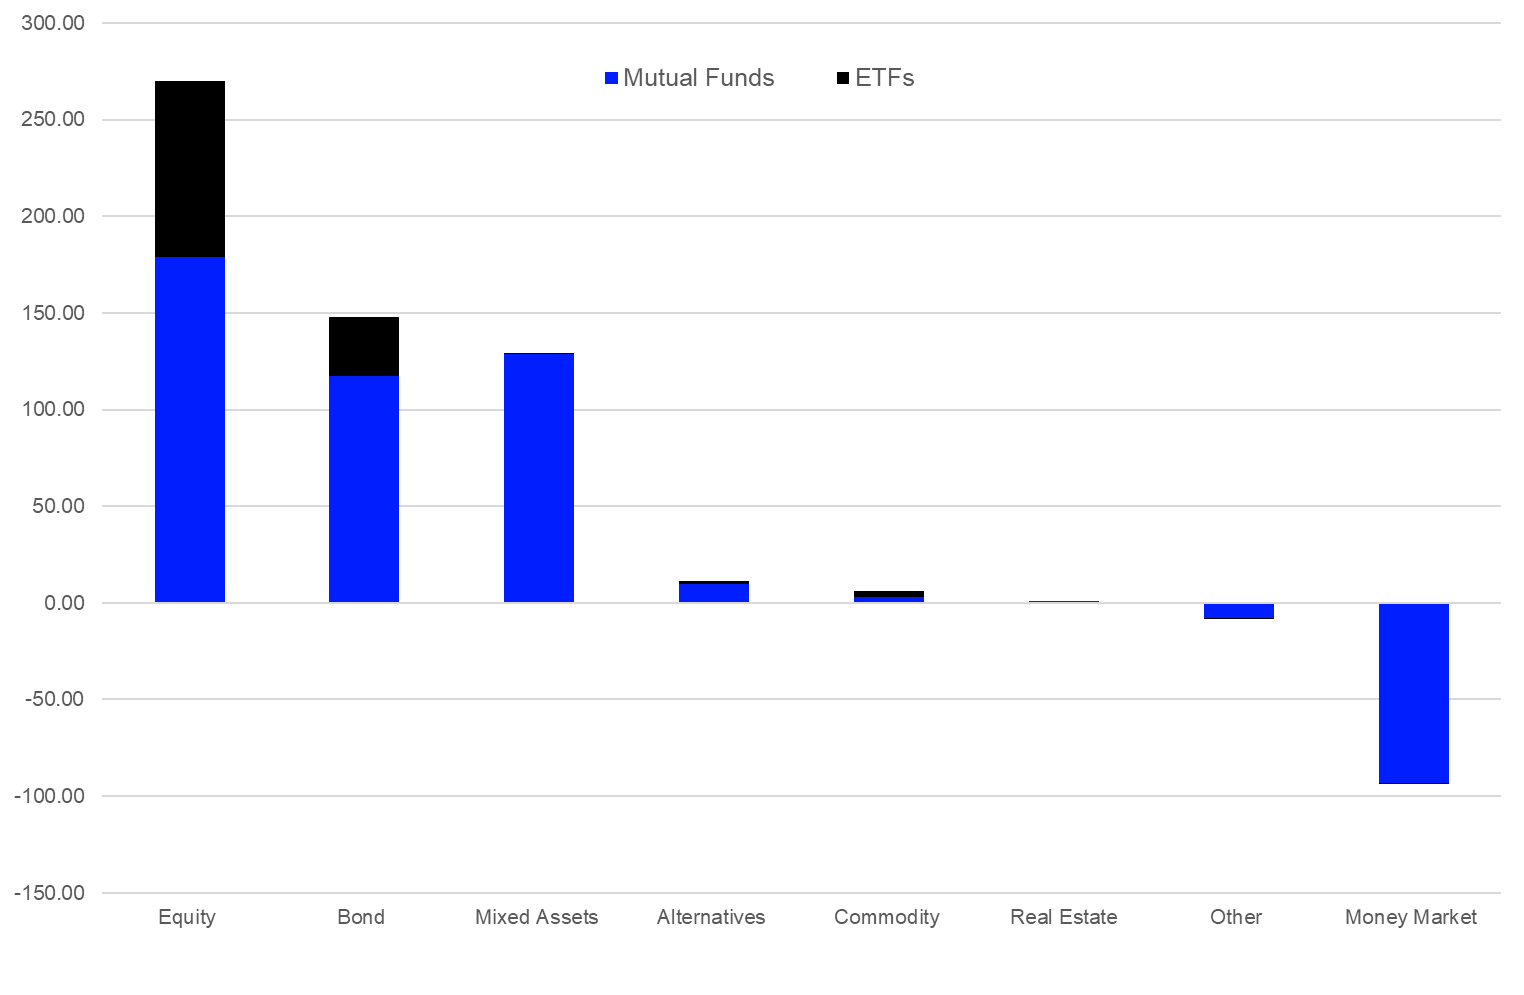
Taking a closer look, equity funds (+€269.8 bn) were the asset type with the highest estimated net inflows overall for 2021 so far. It is followed by bond funds (+€147.7 bn), mixed-assets funds (+€129.3 bn), alternative UCITS funds (+€11.3 bn), commodities funds (+€5.9 bn), and real estate funds (+€0.9 bn). Meanwhile, “other” funds (-€7.9 bn) and money market funds (-€93.1 bn) faced outflows for the year to date.
Graph 3: Estimated Net Sales by Asset and Product Type, January 1 – September 30, 2021 (Euro Billions)
Source: Refinitiv Lipper
Money Market Products
With a market share of 9.84% of the overall assets under management in the European fund management industry, money market products are the fourth largest asset type. Therefore, it is worthwhile to briefly review the trends in this market segment. As the market environment normalized further, with the situation around the COVID-19 pandemic easing up, it was not surprising that European investors reduced their money market positions over the course of the year so far. In line with this expectation, money market funds faced outflows for the month (-€93.1 bn) even as the volatility in the securities market increased. In line with their active peers (-€93.0bn), ETFs investing in money market instruments contributed estimated net outflows of €0.1 bn to the total.
Graph 4: Assets Under Management in Money Market Products (Euro Billions)

Source: Refinitiv Lipper
Ireland (€550.6 bn) was the domicile with the highest assets under management in money market products, followed by Luxembourg (€385.2 bn) and France (€357.1 bn). The combined assets under management in money market products of these three fund domiciles add up to a market share of 90.66% of the overall assets under management in money market products. As shown in chart 4, France is by far the largest local fund domicile for money market products in Europe.
Money Market Products by Lipper Global Classification
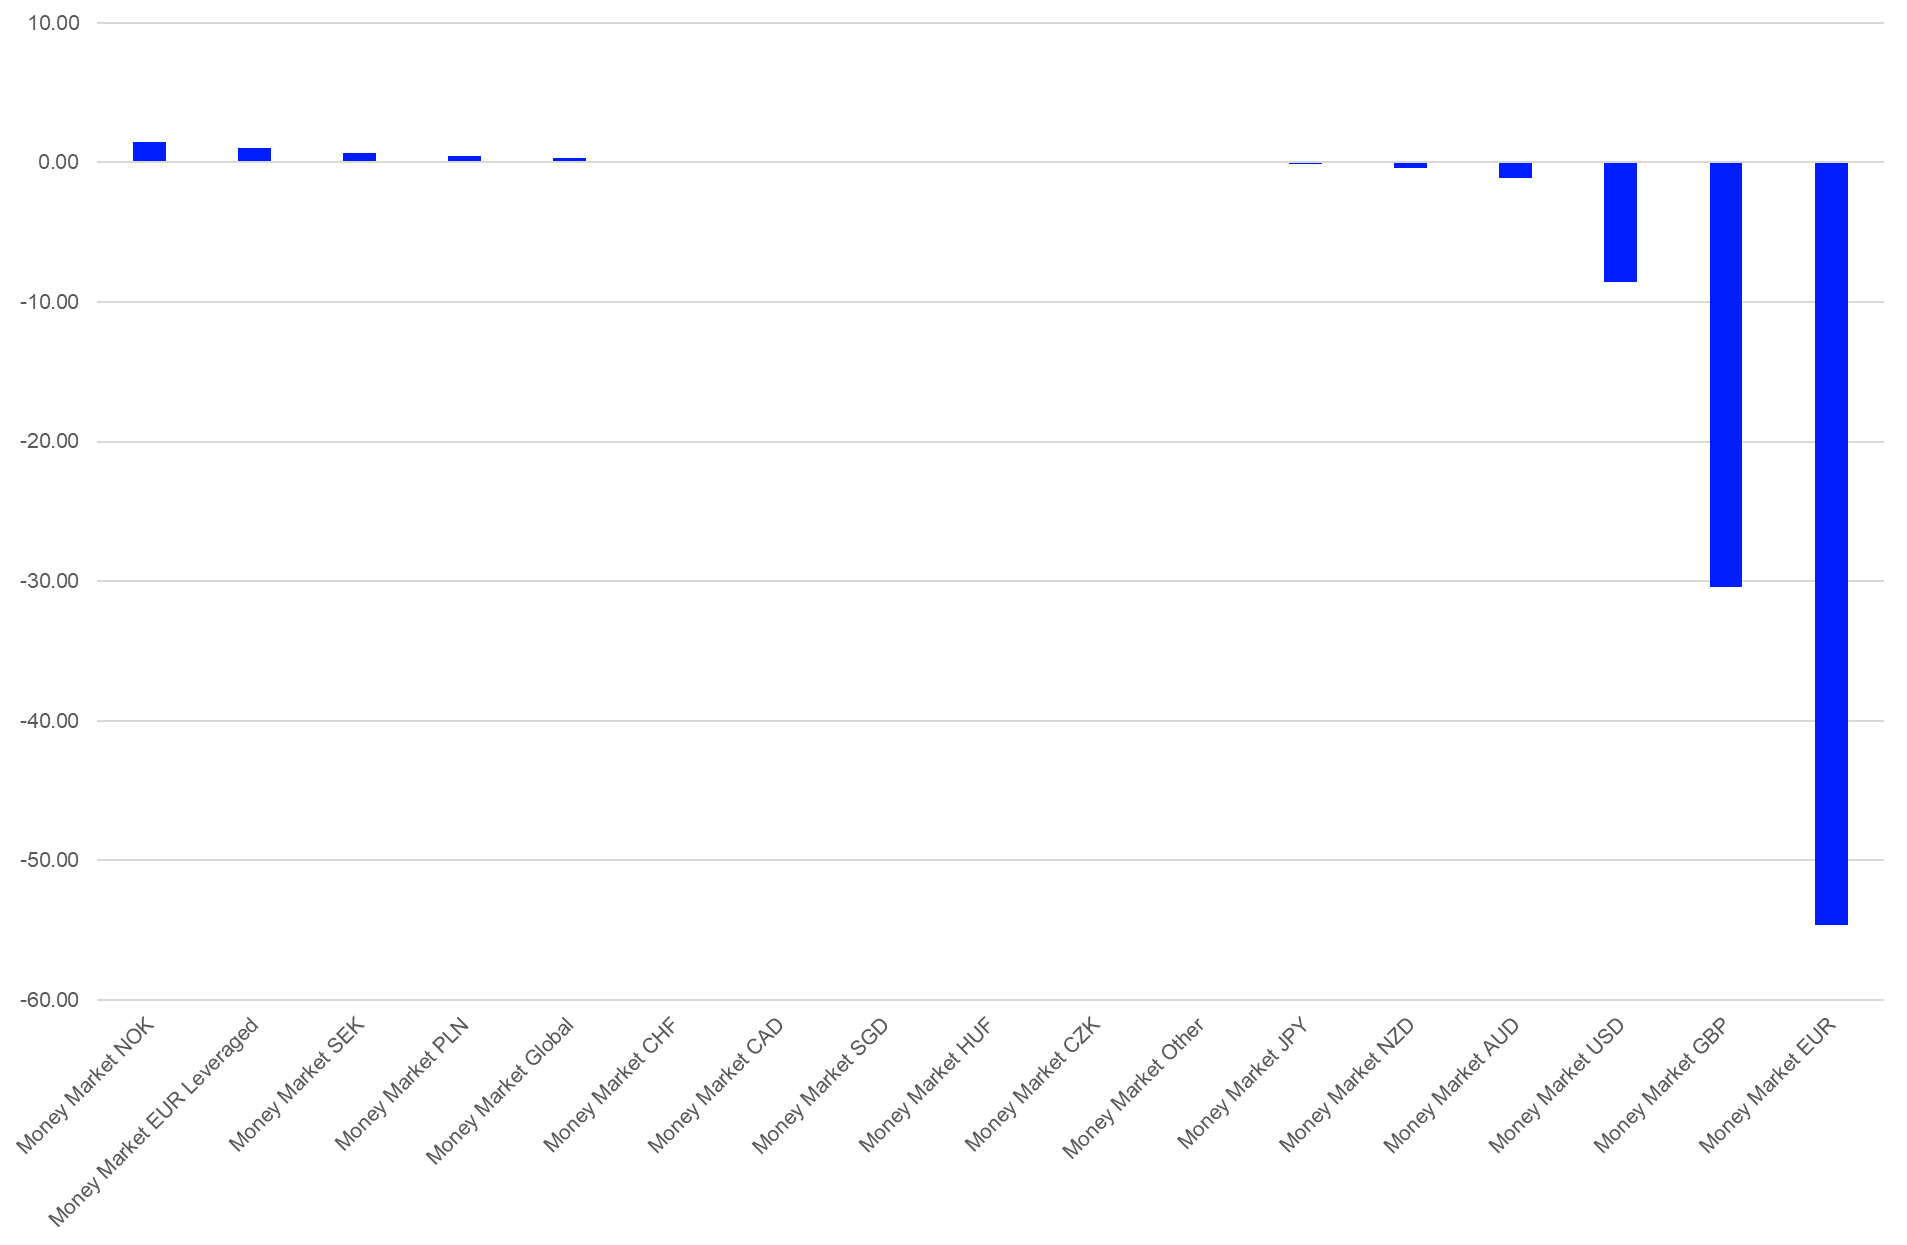
A more detailed view of the trends within the money market segment unveils that Money Market NOK (+€1.8 bn) was the best seller within the money market segment, followed by Money Market EUR Leveraged (+€1.1 bn) and Money Market SEK (+€0.7 bn). At the other end of the spectrum, Money Market EUR (-€54.6 bn) suffered the highest net outflows overall, bettered by Money Market GBP (-€30.4 bn) and Money Market USD (-€8.6 bn).
This flow pattern revealed that European investors sold money market products denominated in the major currencies—euro, GBP, and USD. These flows might be a sign that European investors are still in a risk-on mode even as the volatility in the securities market has increased over the course of the year.
In conjunction with the asset allocation decisions of portfolio managers, these shifts in the money market segment might have also been caused by corporate actions such as cash dividends or cash payments, since money market funds are also used by corporations as replacements for cash accounts.
Graph 5: Estimated Net Flows in Money Market Products by LGC – 01.01.2021 – 30.09.2021 (Euro Billions)
Source: Refinitiv Lipper
Spotlight on the Active Versus Passive Discussion
Despite the fact that the majority of fund flows for the first nine months of 2021 were invested into mutual funds, ETFs are on the way to reach record inflows in 2021 as they already topped the old all-time high for annual flows into ETFs in Europe from 2019 which stood at €106.7 bn.
Graph 6: Estimated Net Sales of ETFs in Europe (Euro Millions)

Source: Refinitiv Lipper
The trend toward passive investment vehicles has been widely discussed by market observers and asset managers, and a new all-time high for inflows into ETFs will fuel these discussions further. Therefore, it is worthwhile to highlight this topic—especially as not all passive products are ETFs. In contrast to the year 2020, flows into ETFs (+€126.9 bn) are outpacing the flows into passive mutual funds (€42.5 bn) by a large margin for 2021 to date.
More generally, there is no evidence that passive funds will continue their pattern from 2020 and overtake actively managed funds, as the majority (€294.5 bn, or 63.48%) of the overall fund flows for 2021 to date were invested in actively managed products. Meanwhile, €169.4 bn—or 36.52%—were invested in passive products. This pattern gets even clearer when one takes money market products into consideration, as the outflows from money market products brought the inflows into actively managed long-term funds up to €387.5 bn and, respectively, the market share of actively managed long-term products up to 69.57% of the overall flows. Meanwhile, passive long-term products had inflows of €169.5 bn—or 30.43%—of the overall inflows.
Graph 7: Market Share of the Estimated Net Flows by Management Approach (January 1 – September 30, 2021)

Source: Refinitiv Lipper
Fund Flows by Lipper Global Classifications
With regard to the overall sales for September, it was not surprising that Equity Global (+€10.4 bn) dominated the table of the 10 best-selling peer groups by estimated net flows. It was followed by Bond Global USD (+€5.5 bn), Equity US (+€4.1 bn), Mixed Assets EUR Balanced – Global (+€3.0 bn), and Bond EUR (+€2.5 bn).
A closer look at the best- and worst-selling Lipper Global Classifications for the first nine months of 2021 shows that European investors sold some of their safe-haven investments while investing in funds that may offer diversification for their portfolio or are focused on single themes, sectors, and countries. This flow pattern shows that European investors are back in a risk-on mode.
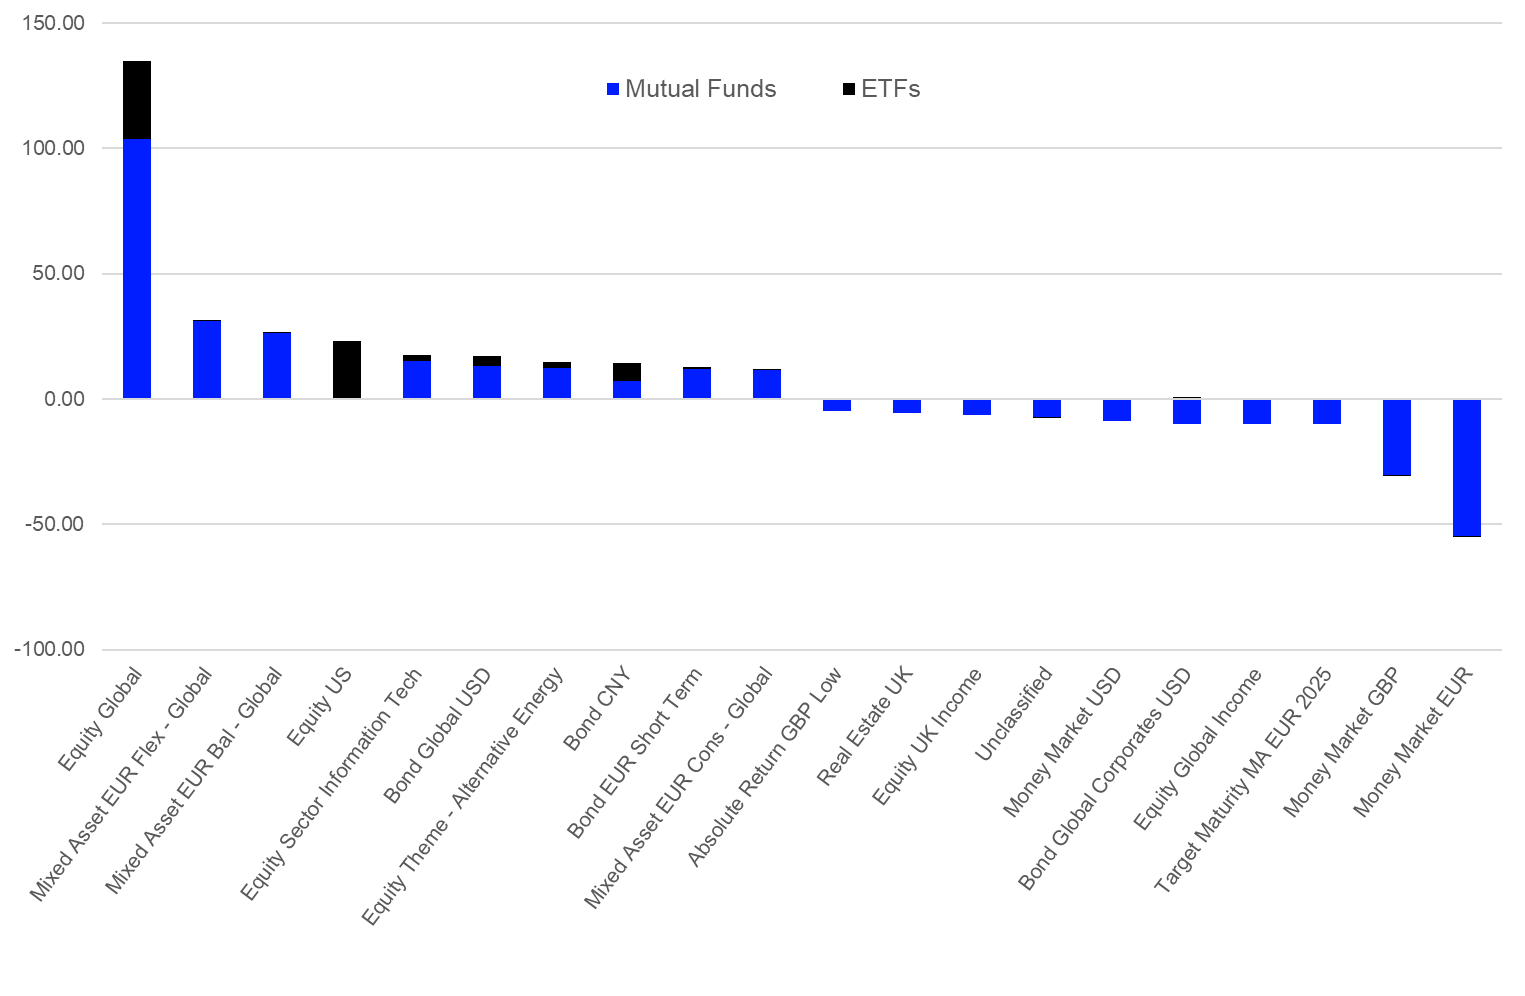
As graph 3 shows, money market products faced—as opposed to in 2020—the highest outflows over the course of the first nine months of 2021, while equity products enjoyed the highest inflows. It is, therefore, not surprising that equity peer groups also dominate the table of the best-selling Lipper Global Classifications year to date. Equity Global (+€134.7 bn) was the best-selling peer group for the year so far. It was followed by Mixed Asset EUR Flexible – Global (+€31.0 bn), Mixed Asset EUR Global – Balanced (+€26.7 bn), Equity US (+€22.5 bn), and Equity Sector Information Technology (+€17.7 bn). It is noteworthy that mixed-assets funds started to gather significant inflows over the course of May and June, which drove the positions of the two mixed-assets classifications within the 10 best-selling classifications up for the year 2021 so far.
Graph 8: Ten Best- and Worst-Selling Lipper Global Classifications by Estimated Net Sales, January 1 – September 30, 2021 (Euro Billions)
Source: Refinitiv Lipper
Conversely, some of the safe-haven favorites of 2020 were at the opposite side of the table. Money Market EUR (-€54.6 bn) faced the highest outflows for the year so far. It was bettered by Money Market GBP (-€30.4 bn), Target Maturity MA EUR 2025 (-€9.9 bn), Equity Global Income (-€9.8 bn), and Bond Global Corporates USD (-€9.5 bn).
It is noteworthy that the estimated flows in money market sectors are not only a reflection of asset allocation decisions of investors since these products are also used by corporates as a replacement for cash accounts.
Fund Flows by Promoters
Unsurprisingly, the largest fund promoter in Europe, BlackRock (+€72.1 bn), is also the best-selling fund promoter over the course of the first nine months of 2021, ahead of Vanguard (+€24.5 bn), UBS (+€24.5 bn), Allianz (+€18.6 bn), and DWS Group (+€17.2 bn).
One needs to bear in mind that the outflows from money market products over the course of 2021 so far have a significant impact on the flow numbers and positions in the league table of the leading fund promoters in Europe. In more detail, BlackRock witnessed €15.4 bn outflows from money market products, while DWS Group (-€5.8 bn), and JPMorgan (-€3.9 bn) also experienced outflows over the course of the first three quarters of 2021.
Graph 9: Ten Best-Selling Fund Promoters in Europe, January 1 – September 30, 2021 (Euro Billions)

Source: Refinitiv Lipper
Considering the single-asset classes, BlackRock (+€18.7 bn) was the best-selling promoter of bond funds, followed by UBS (+€16.3 bn), Vanguard (+€8.0 bn), State Street (+€6.7 bn), and BNP Paribas Asset Management (+€6.5 bn).
Within the equity space, BlackRock (+€64.1 bn) led the table, followed by JPMorgan (+€13.7 bn), DWS Group (+€13.2 bn), Vanguard (+€10.1 bn), and Baillie Gifford (+€9.5 bn).
Allianz (+€9.0 bn) was the leading promoter of mixed-assets funds in Europe, followed by Union Investment (+€7.1 bn), Vanguard (+€6.5 bn), DWS Group (+€5.5 bn), and BlackRock (+€5.0 bn).
Pictet (+€3.0 bn) was the leading promoter of alternative UCITS funds for the month, followed by DWS Group (+€2.7 bn), JPMorgan (+€2.5 bn), Aegon Asset Management (+€1.9 bn), and Nordea (+€1.9 bn).
Fund Flows by Fund Domiciles
Single-fund domicile flows (including those to money market products) showed, in general, a positive picture during May. Twenty-five of the 34 markets covered in this report showed estimated net inflows, and nine showed net outflows. Luxembourg (+€237.5 bn) was the fund domicile with the highest net inflows, followed by Ireland (+€119.0 bn), the UK (+€31.4 bn), Germany (+€25.6 bn), and Spain (+€24.0 bn). On the other side of the table, France (-€30.2 bn) was the fund domicile with the highest outflows, bettered by Finland (-€10.7 bn) and Jersey (-€5.7 bn). It is noteworthy that the fund flows for Luxembourg (-€11.7 bn), France (-€26.3 bn), and Ireland (-€51.6 bn) were impacted by outflows from the money market segment.
Graph 10: Estimated Net Sales by Fund Domiciles, January 1 – September 30, 2021 (Euro Billions)

Source: Refinitiv Lipper
Within the bond sector, funds domiciled in Ireland (+€54.2 bn) led the table, followed by Luxembourg (+€47.7 bn), Switzerland (+€18.3 bn), the Netherlands (+€8.3 bn), and France (+€6.2 bn). Bond funds domiciled in Italy (-€1.6 bn), Liechtenstein (-€1.3 bn), and Guernsey (-€0.5 bn) were at the other end of the table.
For equity funds, products domiciled in Luxembourg (+€135.7 bn) led the table, followed by Ireland (+€99.5 bn), the UK (+€21.1 bn), Germany (+€10.7 bn), and Sweden (+€7.9 bn). Meanwhile, Finland (-€12.6 bn), Switzerland (-€5.0 bn), and France (-€3.1 bn) were the domiciles with the highest estimated net outflows from equity funds.
Regarding mixed-assets products, Luxembourg (+€46.7 bn) was the domicile with the highest estimated net inflows, followed by the UK (+€17.8 bn), Spain (+€13.7 bn), Switzerland (+€8.2 bn), and Germany (+€7.6 bn). In contrast, Jersey (-€1.1 bn), Denmark (-€0.9 bn), and Liechtenstein (-€0.6 bn) were the domiciles with the highest estimated net outflows from mixed-assets funds.
Luxembourg (+€17.9 bn) was the domicile with the highest estimated net inflows into alternative UCITS funds, followed by Ireland (+€8.9 bn) and Germany (+€1.0 bn). Meanwhile, France (-€8.9 bn), the UK (-€5.7 bn), and Italy (-€2.9 bn) were at the other end of the table.
Promoter Activity—Fund Launches, Liquidations, and Mergers
The ongoing risk appetite of European investors led to a further normalization of the fund flow pattern in the European fund industry, while the situation with regard to the COVID-19 pandemic started to get worse around the globe. Within this environment, the activity of European fund promoters in terms of fund launches, liquidations, and mergers indicated that the industry is further in a business-as-usual mode as we witnessed a slight increase in the overall number of primary funds in Europe over the first nine months of 2021. In line with the positive trend for the third quarter, we expect to see the fourth year of growth of the number of funds since Lipper began to study these developments in 2012. More generally, the decreasing number of funds over the course of Q2 2021 was breaking a trend in Europe, but the number of funds returned to the expected growth pattern over the course of Q3 2021 and continued the long-term trend of a declining number of fund liquidations and mergers which has been in place for more than seven consecutive years.
The net increasing number of funds for the first nine months of 2021 occurred in a volatile but, in general, positive market environment with increasing assets under management. Therefore, it was somewhat surprising that fund promoters showed a generally lower level of activity with regard to fund launches, and the maintenance of their existing product ranges. In more detail, the number of fund liquidations (789) and mergers (530) over the course of the first three quarters of 2021 were below the long-term nine-month averages—liquidations (946), mergers (737)—while the number of fund launches (1,396) was above the long-term average for launches (1,391). As a result of the decreasing number liquidations and mergers and the increased number of fund launches, the overall number of funds increased by 77 for the year so far. One of the reasons for the mergers and liquidations at the fund level were restructurings of the general product offerings. For example, some fund promoters merged funds with a similar investment objective to strengthen their product ranges.
Lower profitability because of a lack of assets under management might have been another reason why fund promoters merged or liquidated some funds. At the top-line level, the activity of fund promoters with regard to fund launches and liquidations seemed to be in line with the activity over the other years covered in this report, as we don’t witness any excess activity for fund launches, liquidations, or mergers. Since the implementation of new regulations, such as MiFID II, does increase the cost for maintaining a fund, we expect that the trend of consolidation of small funds will continue in 2021 and beyond.
Graph 11: Fund Launches, Liquidations, and Mergers

Source: Refinitiv Lipper
European fund promoters liquidated 789 funds over the course of first nine months of 2021, while 530 funds were merged into other funds. By contrast, European fund promoters launched 1,396 funds. This means the overall number of primary funds in Europe decreased by 77 products over the course of the first three quarters of 2021.
A more detailed view shows that equity funds experienced the highest number of fund launches (599) and liquidations (293), while mixed-assets products had the highest number of mergers (183) for the first nine months of the year. With regard to the broader trends in financial markets and the trends in the European fund industry, it was not surprising equity funds showed the highest number of fund launches given the fact equities is the asset type with the highest number of funds. The underlying trends for the high activity in this sector might be the current market environment and the trends toward passive and/or ESG-related products. The latter is also true for other asset classes.
Graph 12: Fund Launches, Liquidations, and Mergers Q1 – Q3 2021 by Asset Type

Source: Refinitiv Lipper

