Through one of the most volatile years on record, the S&P 500 has managed to record a total-return of 9.4% year-to-date. The S&P 500 also reached a new all-time high on September 2nd thanks to the strong performance of FAAMG stocks (Facebook, Amazon, Apple, Microsoft, and Alphabet). With fears of a second COVID-19 wave and a contentious U.S. election ahead, uncertainty remains at record levels. As a result, we look at valuation levels to gauge future investment decisions considering this environment.
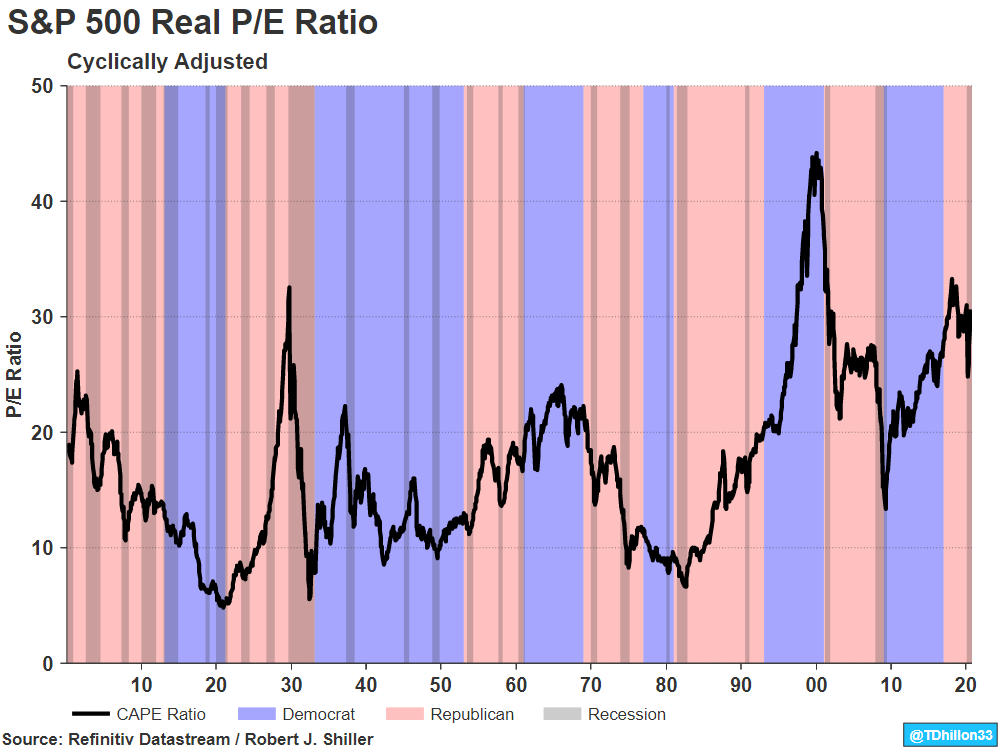
The graph above displays the inflation-adjusted (real) P/E ratio of the S&P 500 since 1900. The Shiller Cyclically Adjusted Price Earnings (CAPE) ratio is defined based on average inflation-adjusted earnings from the previous 10 years.
Before going into the data, users of Datastream will recognize that this chart is going prior to 1950, which is the current limit to how much history is stored for a single time-series. However, the earliest values for a select number of series on Datastream is being moved back from 1950 to 1900 effective this month. Please visit Datastream Infobase for further information.
In the graph above, the latest P/E ratio in August reads 30.6x, which is well above the prior 10-year average of 26.2x and historical long-term average of 17.1x, marking stocks as ‘expensive’.
If we look at how expensive stocks are on a forward 12-month basis, we also arrive at the same conclusion. The forward 12-month P/E ratio for the S&P 500 is 21.7x in comparison to a 10-year average of 15.7x, representing a 38% premium. According to Refinitiv Datastream, 67% of S&P 500 constituents are trading above its historical 10-year average forward P/E.
Exhibit 1 provides a more granular view on valuation within the S&P 500 by looking at sector-level data. All sectors currently are trading at a premium to their historical 10-year average. Consumer Discretionary Technology has a forward 12-month P/E ratio of 34.3x vs. a 10-year average of 18.7x, marking an 83% premium making it the most expensive sector. It is worth noting that Amazon resides in this sector. Information Technology is the second most expensive sector with a forward P/E of 26.1x, representing a 63% premium.
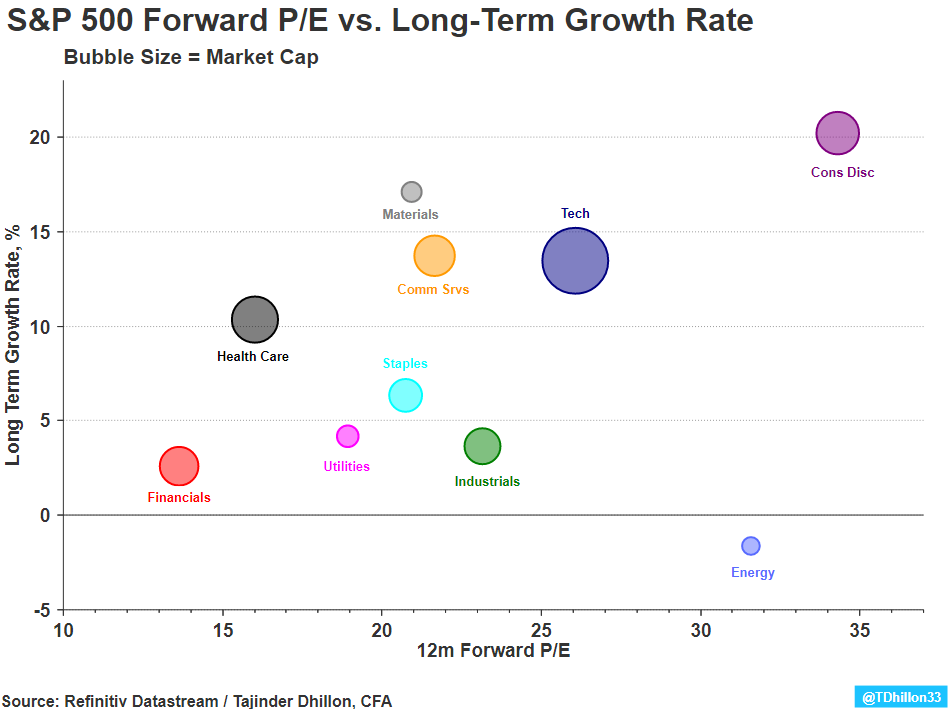
In the graph below, we plot the forward P/E vs. the long-term earnings growth rate. A premium can be justified if future earnings growth looks promising. Economic theory indicates a company is valued based on the present value of its future cash flows. With interest rates at record lows, the discount rate used is also low, resulting in higher values for a company. As a result, a company with growing cash flows will certainly fetch a higher valuation vs. a company with weaker growth prospects.
Exhibit 1: S&P 500 GICS Forward P/E vs. Long-Term Earnings Growth Rate
Want more charts and analysis? Access a pre-built library of charts built by Fathom Consulting via Datastream Chartbook in Refinitiv Eikon.
Consumer Discretionary has the highest long-term growth rate at 20.2% which provides a view that current valuation levels may be justified. Information Technology also has a strong long-term growth rate of 13.4%.
On a relative basis, Financials, Utilities, and Consumer Staples are amongst the cheapest sectors and have the lowest long-term growth rates. Energy, one of the most expensive sectors at 31.6x has a -1.6% long-term growth rate. It may be likely to see a reversion to the mean from a valuation perspective (10-year average is 23.1x).
With growth outperforming value over the last decade, reversion to the mean could come to the forefront as high levels of uncertainty combined with unexpected results could whipsaw matters faster than expected.
Refinitiv Datastream
Financial time series database which allows you to identify and examine trends, generate and test ideas and develop view points on the market.
Refinitiv offers the world’s most comprehensive historical database for numerical macroeconomic and cross-asset financial data which started in the 1950s and has grown into an indispensable resource for financial professionals. Find out more.