
Refinitiv Lipper’s analysis of environmental, social, and governance (ESG) investments in the UK market.
Negative performance across most markets is translating into negative sentiment, with net redemptions in long-term assets running to £49.9bn for the first six months of the year—£15.6bn of that coming out of equity funds.
However, ESG flows look resilient so far, with net flows for long-term assets employing such strategies standing at £16.6bn—£11.3bn of that to ESG equity funds (p4).
As we noted in the previous quarter’s report, this is despite the erosion of the performance premium that’s been enjoyed by top-selling ESG sectors over a protracted period. A prime example of this is the top-selling Equity Global classification, where the lead of ESG funds over three and five years has been reversed over 12 months and is consequently narrowing in the longer periods. However, that’s far from a universal phenomenon: with the (albeit inconsistent) revival of value this year, investors are upping their allocations to Equity Global Income funds. And here the situation is reversed, with non-ESG funds outperforming their ESG peers over three and five years, but lagging over one (see p8).
Long-Term ESG Flows Still Positive Across the Board, Despite Negative Market Sentiment
- Asset Class: All ESG asset classes, money markets excepted, saw net inflows over H122 of £16.6bn. Money market ESG outflows were £15.3bn.
- Classification: Equity Global once again tops the ESG table, taking £10.8bn, indicating a slower flow rate than for Q1.
- Performance: Top-selling “Green” Equity Global outperforms “brown” over three and five years, reversing over 12 months. However, the opposite is true for Equity Global Income.
- Passive Equity: 11 of the 12 top index-tracking equity mutual funds were Global Equity, taking a total of £4bn.
ESG v Conventional Flows by Asset Class
Chart 1: Asset Class Flows, ESG v Conventional, H1 2022 (£bn)
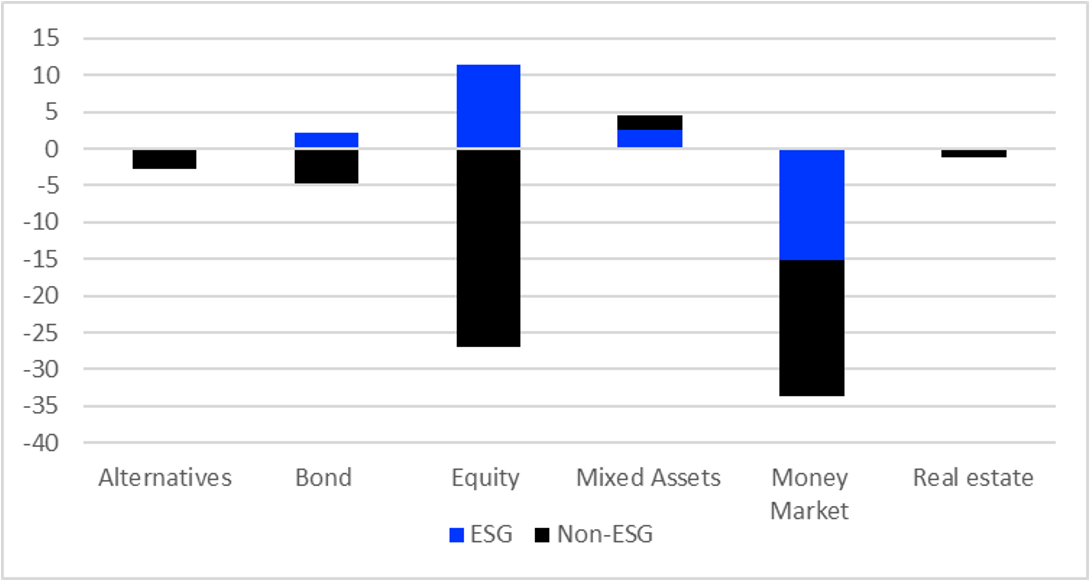
Source: Refinitiv Lipper
Despite uncertainty and volatility, broad-brush trends for the first half of the year continue those of the first quarter, with all ESG asset classes, money markets excepted, seeing net inflows.
Over the first half of the year, ESG equity funds saw the largest net inflows, at £11.4bn—42% of the overall outflows for their non-ESG peers, at £26.9bn.
ESG alternatives, bond, and real estate funds saw inflows while their conventional peers experienced redemptions. Meanwhile, both classes of money market funds were in the red (-£15.3bn an -£18.5bn, respectively) and both mixed-assets categories were in the black (£2.7bn and £1.8bn). Mixed-assets were the only asset class with ESG flows being greater than their non-ESG equivalents.
It’s a similar picture over one quarter (Q2) and 12-month view, with all long-term ESG asset classes in the black, although non-ESG mixed-assets funds have only dipped into negative territory (-£409m) over the past quarter.
ESG/Non ESG Flows by Classification
Chart 2: Largest Positive ESG Flows by Refinitiv Lipper Global Classification, H1 2022 (£bn)
Versus Conventional Equivalents
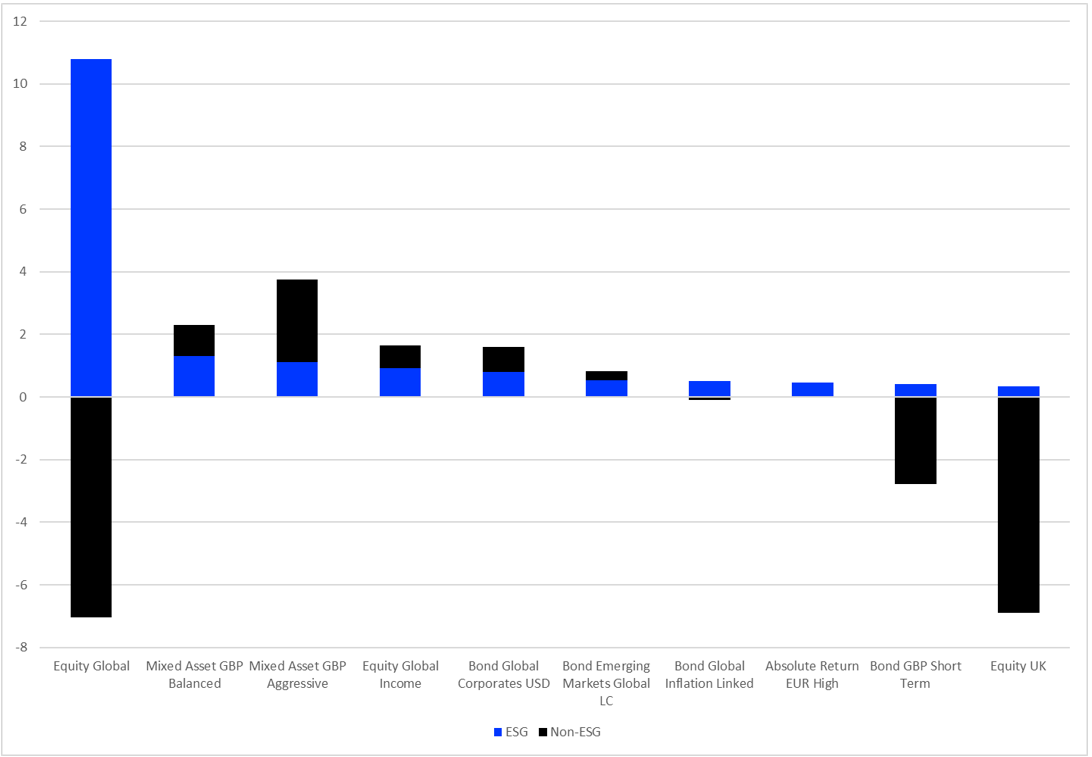
Source: Refinitiv Lipper
Equity Global ESG once again tops the table, taking £10.8bn over the first half of the year. That said, there’s been a slowing of inflows in the second quarter, with the classification adding just £3.2bn to its first-quarter take of £7.6bn. Outflows for Equity Global non-ESG are broadly same over both quarters, at about £3.5bn. However, Equity Global Income now makes an appearance, with £933m of inflows (£723m outflows for non-ESG), indicating investors have taken more of a value tilt to their global equity allocations.
Other than Equity UK, where non-ESG outflows of £6.9bn dwarf the ESG inflows of £403m, no other equity classifications appear in the top 10. Equity Emerging Markets Global are eleventh placed, with £330m over the first six months, but that’s a scant £16m on top of their take for the first quarter of the year.
Bond Global Corporate USD took £812m, with their non-ESG peers seeing inflows of slightly less. Dollar-denominated assets are likely to be attractive in this environment, both for the greenback’s safe-haven status and for the higher yield potential for such assets.
Local-currency global emerging market debt, where central banks are seen to have moved earlier than the Fed, are proving attractive (£544m ESG and £276m non-ESG), as opposed to their hard-currency peers, vulnerable to Fed rises, which have seen half year outflows of £59m and £142m for ESG and non-ESG funds, respectively.
Inflation-linked GBP ESG bond funds took £507m (with £98m outflows for their non-ESG equivalents). While Bond GBP Short Term ESG funds saw inflows of £403m, their non-ESG peers were down £2.8bn. That’s an increasing rate of both allocation to ESG funds and redemptions from non-ESG funds on the first quarter, where the figures for short-term GBP were £31m and -£799m, respectively.
Mixed Asset GBP Balanced and Aggressive ESG funds took £1.3bn and £1.1bn, respectively, with their non-ESG peers also enjoying net gains. As we’ve argued elsewhere, this looks like retail investors deploying savings squirreled away over COVID and, as such, may trail off as social life normalises, but with the prospect of economic conditions worsening.
Chart 3: Largest Negative ESG Flows by Refinitiv Lipper Global Classification, H1 2022 (£bn)
Versus Conventional Equivalents

Source: Refinitiv Lipper
When we started running this study a year ago, we didn’t publish ESG outflows, simply because there weren’t any of which to speak. Over six months, excluding money market funds, there’s still not a whole load of red ink being spilt—but ESG redemptions are becoming significant in certain areas, so we start recording negative flows at the classification level.
Money market funds shed £15.3bn over the period, way ahead of the nearest long-term fund sectors: Equity UK Income (-£864m), Alternative Credit Focus (-£502m), and Equity Sector Information Tech (-£323m).
We noted last quarter that, aside from money market vehicles, most outflows were all bonds, accounting for £5.3bn of redemptions. For the first half of the year, while ESG dollar- and sterling-denominated bonds have seen redemptions. Overall, the classifications are in the black, perhaps signalling a turn from inflationary to recessionary concerns on the part of investors.
Chart 4: ESG Top-Selling Classification Performance Versus Conventional Equivalents,
H1 2022 (Percentage Growth)

Source: Refinitiv Lipper
Chart 4 takes three top-selling sectors over H122 and compares the ESG and non-ESG performance within these classifications over one, three, and five years.
This quarter, we’ve taken Equity Global, as the top-selling classification for the period, Mixed Asset GBP Aggressive, and Equity Global Income. We’ve skipped over second-placed Mixed Asset GBP Balanced, as its Aggressive sibling demonstrates the same pattern but with greater amplitude and have lighted instead on Equity Global Income as it makes for a thought-provoking contrast to Equity Global.
The comparison of Equity Global and its Income sibling is instructive because it shows there’s something more going on here than just a change in style leadership, as growthy-Global gets overtaken over 12 months by value-biased Income. That would be potentially sufficient to explain the outperformance of Equity Global Income over Equity Global over 12 months; it could also explain the outperformance of non-ESG over ESG within Equity Global over this period—but what it doesn’t help with is the outperformance of ESG Equity Global Income over Equity Global. Figuring out what’s driving this is something that will take a little more digging at the portfolio level, starting with sector allocations, and something that we will return to in due course.
Chart 5: ESG Active v Passive Asset Class Flows, H1 2022 (£bn)
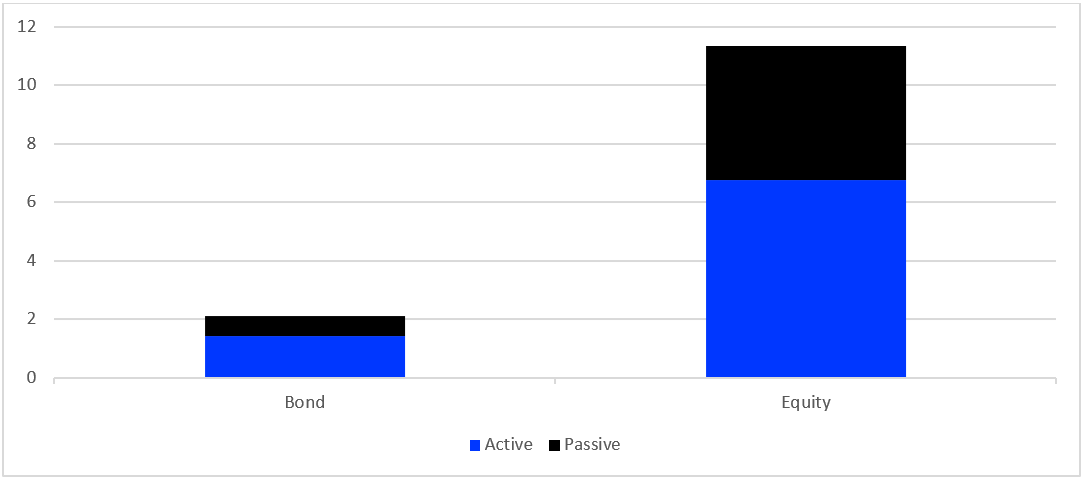
Source: Refinitiv Lipper
Passive fixed income flows split £589m ETFs/£83m mutual funds. This was dominated by one Bond Global Corporates USD ETF, the Fidelity Sustainable Global Corporate Bond Multifactor U ETF HGBP Acc, which netted £469m over the period.
Equities, however, went £507m ETFs/£4.1bn mutual funds. Again, one share class dominated ETF flows: the Equity UK UBS (Irl) ETF plc MSCI UK IMI SR UCITS ETF GBP Ad, netting £231m, despite a title that hardly trips off the tongue.
Takings for equity passive mutual funds were more evenly distributed, even if the classifications they went to weren’t, with 11 out of the top 12 being Equity Global funds, collectively taking £4bn: the exception being £413m going to the Royal London Emerging Markets ESG Leaders Equity Tracker.
Flows by Asset Manager
Chart 6: Largest Positive ESG Flows by Promoter, H1 2022 (£bn)
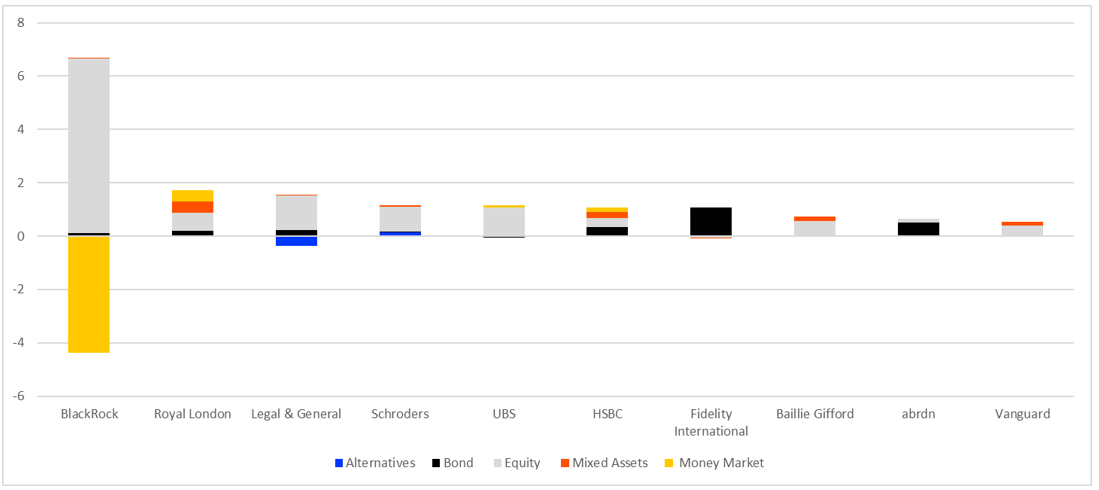
Source: Refinitiv Lipper
BlackRock, as it was in Q1, is way out in front for the first half of the year, netting £2.3bn for the period. ESG equity inflows for the period stood at £6.6bn, compared to £5.1bn for Q1, indicating a waning appetite for equities. Second-placed Royal London took £1.7bn over the quarter, with £668m from equity funds.
As with Q1, Fidelity enjoyed the largest bond inflows (£1.1bn). Royal London took most mixed-assets (£433m), and Schroders led in alternatives (£139m).

