“History doesn’t repeat itself, but it often rhymes,” as Mark Twain is often quoted as saying. When it comes to the credit cycle and the stock market, the ups and downs most definitely rhyme. The challenge for investors is to be in equities in the upswing of the cycle, selling out before the downswing starts due to rising default rates.
The Swedish economist Knut Wicksell argued that when the return on capital was higher than the cost of capital, it would lead to a cumulative process of excess credit creation due to higher expectations of profits. This might come about because of a higher return on capital and/or a fall in the cost of capital.
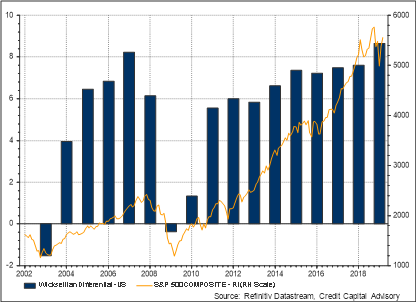
Chart 1 shows the relationship between the Wicksellian Differential and the S&P 500 since 2002. The Wicksellian Differential, which describes whether the rate of profit growth is increasing or decreasing, is unsurprisingly closely related to equity market performance.
Chart 1: U.S. Wicksellian Differential vs S&P 500
The Wicksellian cumulative process
During the global financial crisis, the Federal Reserve loosened monetary policy in an attempt to reduce the cost of funding across the real economy. The result of this, in combination with a rising return on capital, is that the U.S. economy since 2010 has been in a Wicksellian cumulative process just as it was from 2003. During a Wicksellian cumulative process, excess credit is often invested in financial assets rather than the real economy. And because low short-term interest rates generally drive investment grade yields down, investors tend to seek out higher yielding assets that are riskier.
While profit rates are rising, the probability of default on these riskier assets is reasonably low, however, once the rate of profit growth starts to fall, the ability of leveraged assets to pay back debt can become challenging. Hence a slowing economy can lead to lots of highly leveraged assets beginning to default at the same time. It is this event that is more likely to trigger an economic downturn.
Investor behavior also seems to chime to the rhyme of history. On the cusp of the financial crisis, investors were still piling into subprime mortgages despite the fact that house prices were already falling. Today mortgages are not so risky but since 2010, debt issuance of privately-owned firms has soared by nearly 50%. Crucially, this debt is on average two rating notches lower than publicly listed firms and with a much greater exposure to lower credit quality — as shown in Chart 2. Moreover, increasing amounts of loans are being sold to investors with far less transparency on the borrowers’ financial performance. This resembles the mortgage debacle prior to the financial crisis when the issuance of Alt-A mortgages based on limited documentation soared, and which subsequently saw a dramatic rise in delinquency rates.
Chart 2: Rating Distribution of U.S. Corporate issuance: Public vs Private Firms Since 2010
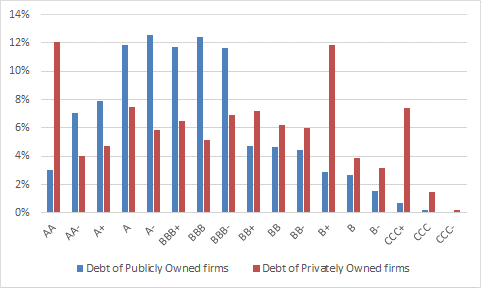
Source: Refinitiv Deals, Credit Capital Advisory
Private company debt profile
One reason why private companies have this debt profile is that investors tend to short public firms that have very high debt to EBITDA ratios, which acts as a constraint on management behaviour. Another reason for this debt profile is the business model pursued by some private equity firms can result in very high debt-to-EDITDA ratios, where the debt is often used to pay dividends to meet investment return thresholds. This partly explains why the default rates of private equity owned firms can be as much as ten times higher than a control sample. It is also noteworthy that the recent Fed Open Market Committee minutes warned that leveraged lending poses risks to the economic outlook.
One concern for the Fed if these leveraged loans start to default is that flooring the federal funds target rate and quantitative easing will have less of an impact. Chart 3 indicates a close correlation between the 3-month Treasury bill, the 5-year benchmark and the 5-year BBB rate. In the event Treasury bill interest rates trend towards zero, the BBB cost of funding should fall, enabling investment grade firms to refinance their existing debt at lower rates. However, the marginal gain will be much less than during the crisis when rates halved from around 6% to 3%. BBB rates have averaged roughly 3.75% since 2013.
The same cannot be said for high yield rates though. While looser monetary policy did have an effect in the early part of the crisis with the high yield rate falling from 17% in 2009 to close to 5% in 2010, since 2011 high yield rates have been more correlated to the price of oil.
Chart 3: Bond market indicators – U.S.

Credit cycle investing
The challenge for investors is that it is almost impossible to know when these highly leveraged firms will stop being able to service their debt, and once the market has turned it is very difficult to find buyers of assets that are falling in value without taking heavy losses.
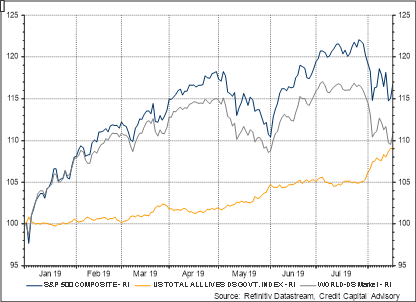
Investors can avoid being long risk assets in the downturn by using an indication of the expected trend of the Wicksellian Differential. This enables investors to generate excess returns above buy and hold by not being in equities when the market turns. In February the ex ante model indicated that the rate of profit was expected to fall, hence the shift in allocation from equities to bonds. The results of this strategy have been extremely favourable with 20% year-to-date returns compared to 15% for U.S. equities, 10% for global equities and 9% for U.S. government bonds.
Chart 4: YTD: Total returns, U.S. equities, U.S. bonds and Global Equities
More gloom ahead
The ex ante signal for Q3 2019 is continuing to indicate a downward trend in expected profit growth across nearly all sectors, with consumer and corporate leverage ratios also implying lower expected profits. Both the micro and macro picture indicate a poor outlook for being long risk assets.
Table 1: Ex Ante Indicators: U.S.

Source: Refinitiv Datastream, Credit Capital Advisory
Mark Twain investment guru?
While some traders might still be able to eke out incremental returns, investors might do well to heed Mark Twain’s investment advice of not speculating in any month of the year. Furthermore, his comments on history rhyming might lead investors to contemplate investing across the credit cycle which since the last crisis generated more than 2% excess return on equity buy and hold per annum. Anticipating the fall in profits enables investors to be in safe assets when defaults starts to increase as result of a credit boom. During the global financial crisis these assets were sub-prime and low documentation mortgages. The next downturn may well be caused by low documentation, highly-leveraged private company debt.
Thomas Aubrey is the founder of Credit Capital Advisory.