Investors eagerly await the unofficial kickoff to 2020’s third quarter earnings season during the week of October 12. This comes at a time of heightened volatility where the S&P 500 index (.SPX) climbed 15.73% between the June 30 close and September 2 all-time high of 3,588.11 before falling 10.55% to the September 24 low of 3,209.45. With the U.S. presidential election looming and an index that has rebounded 8.34% to 3,477.13 as of the October 9 close, the stakes are high heading into the 2020 Q3 earnings season. Adding to the pressure is a high bar set by multiple new records within the S&P 500’s second quarter’s earnings; however, several measures indicate that 2020 Q3’s earnings estimates are still too low.
Exhibit 1: S&P 500 Earnings Beat Rate and Earnings Surprise % History

Source: I/B/E/S data from Refinitiv
Two of the more important metrics that demonstrate where estimates are relative to actual results are the percentage of companies that beat earnings estimates and the earnings surprise percent, which measures the magnitude of the difference between reported earnings and the estimate. In 2020 Q2, 82.6% of S&P 500 companies reported earnings above expectations, which set a new record (going back to 1994), surpassed the old high of 78.9%, set in 2009 Q3, and came in well above the long-term average of 65.1%. The S&P 500’s 2020 Q2 earnings also surprised by a record 22.9%, which was substantially above the long-term average of 3.5% and prior high of 14.6%, set in 2009 Q3. To date, the 22 S&P 500 companies that have reported 2020 Q3 strongly indicate that analyst estimates for 2020 Q3 earnings are too low, 90.9% exceeded earnings expectations with aggregate earnings 22.9% above consensus.
Exhibit 2: S&P 500 Percentage of Weekly Upward Annual Earnings Revisions
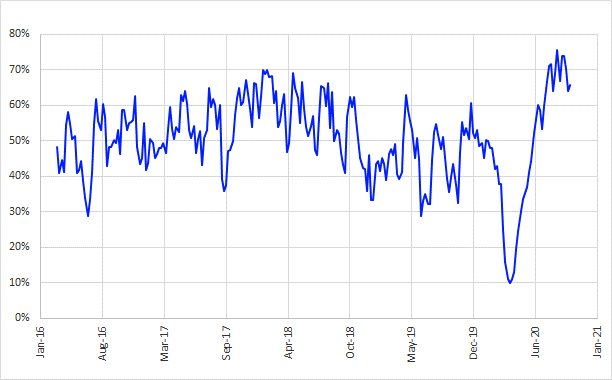
Sources: Eikon, I/B/E/S data from Refinitiv
Analyst revisions are another measure that supports the idea that 2020 Q3 earnings are too low. Looking back to May of 2016 shows that on average, 51% of annual earnings revisions to S&P 500 companies are positive. Since the start of the third quarter, 70% of analysts’ annual earnings revisions have been positive. Additionally, upward revisions represented 66% of annual earnings revisions over the past week. This trend appears to be consistent within the quarterly data as well, where 66% of revisions to this quarter’s earnings estimates were positive over both the past seven days and thirty days.
Exhibit 3: S&P 500 PPTS Changes in 20Q3 Y/Y Earnings – Start Qtr to Start Earnings Season
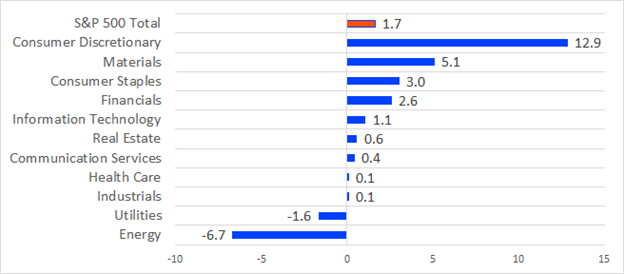
Source: I/B/E/S data from Refinitiv
In a typical quarter, as analysts refine their estimates heading into earnings season, the S&P 500’s year-on-year (Y/Y) growth expectations decline by an average of 3.7 percentage points (ppts) from the start of the quarter to the start of earnings season. However, 2020 Q3 Y/Y earnings increased by 1.7 ppts over this period to -21.4% on Oct. 1, 2020. The consumer discretionary sector saw the greatest improvements over this period, with Y/Y earnings increasing 12.9 ppts to -33.8% by Oct. 1. Conversely, the energy sector saw expectations decline by 6.7 ppts to -117.0%.
Exhibit 4: S&P 500 Quarterly Negative to Positive Earnings Guidance Ratio History

Sources: QA Direct, I/B/E/S data from Refinitiv
Under normal circumstances, one of the best sources of information for the upcoming quarter’s earnings would be guidance provided by the companies themselves. Unfortunately, since Covid-19, many companies have stopped providing guidance. To put this into perspective, since 1997, the average number of quarterly pre-announcements was 170. In Q2 only 65 pre-announced and Q3 currently has 73. While the number of companies providing guidance is substantially lower than historical averages, one aspect stands out, the negative to positive ratio (N/P). The N/P is used to gauge guidance sentiment, where smaller N/P’s are more bullish. There are currently 27 negative earnings pre-announcements vs. 39 positives, which yields N/P of 0.7, making it the most bullish on record (since 1997). The long-term average N/P is 2.7 and it has only fallen to 1.0 or lower four times since being recorded.
Less corporate guidance makes it more difficult for analysts to anticipate earnings. StarMine SmartEstimates® help you better predict future earnings and analyst revisions with estimates that place more weight on recent forecasts by top-rated analysts. SmartEstimates® are created in two steps. First, we exclude stale estimates, then weight the remaining estimates based on each analyst’s track record and the date of the estimate. A StarMine Predictive Surprise then compares the SmartEstimate® to the I/B/E/S consensus. When the earnings Predicted Surprise % is +/-2% or more, our research shows that you can anticipate the direction of earnings surprises with an accuracy rate of over 70%. Revenue Predicted Surprises are even more predictive, with a historical accuracy rate of 78%.
Exhibit 5: S&P 500 ARM Scores, Positive Predicted Surprise, F4Q P/E, and Profit Margin
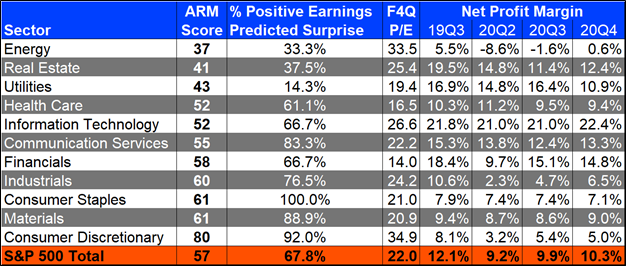
Sources: Eikon Aggregates App, StarMine, I/B/E/S data from Refinitiv
In the second quarter of 2020, StarMine models accurately picked five North American companies that would miss earnings estimates and five that would beat, which can be seen here. Screening for 2020 Q3 S&P 500 earnings Predicted Surprise candidates shows 67.8% are positive Predicted Surprises. This means that further upward revisions to earnings estimates should be expected.
StarMine’s Analyst Revisions Model (ARM) measures analyst sentiment on a scale of 1 to 100, with 100 being the most bullish. Looking at the S&P 500’s aggregated ARM scores in conjunction with the percentage of positive earnings Predicted Surprises, strongly indicates that the consumer discretionary sector’s current earnings estimates are too low, while analysts look to be bearish on the energy sector. Further analysis of the energy sector shows the sector has the second highest forward four quarter price to earnings ratio (F4Q P/E) of 33.5 and that while net profit margins are expected to decline 7.0 ppts from the prior year, analysts anticipate they will improve quarter-over-quarter.
Heading into 20Q3 earnings season, several indicators and quant models are showing that earnings estimates for the quarter are too low. This implies that companies will report results well above the current consensus forecasts and that further upward revisions to earnings estimates should be expected.
Each week the StarMine Earnings Surprise Forecast is published as part of the This Week in Earnings report. The forecast shows the S&P 500 companies with significant positive and negative Predicted Surprises expected to report over the next two weeks. Don’t be surprised when your holdings show up in This Week in Earnings, learn how to use Eikon from Refinitiv’s Screener app to see these companies ahead of publication here.
Refinitiv offers a powerful combination of content, analytics and tools for better investment research, find out more.
Republication or redistribution of Reuters content, including by framing or similar means, is prohibited without the prior written consent of Reuters. Reuters and the Reuters logo are registered trademarks, and trademarks of the Thomson Reuters group of companies. For additional information on Reuters photographic services, please visit the web site at http://pictures.reuters.com


