Judging from the graph above, you might not be blamed for claiming everything we learned from Fama and French is obsolete and that traditional factors no longer work.
For any of you who find that reference obscure, Eugene Fama and Kenneth French, while professors at the University of Chicago in the early 90’s, published research that expanded the Capital Asset Pricing Model (CAPM) beyond the single factor, Beta, adding a size factor and a valuation factor. This is now referred to as the Fama-French three-factor model.
The assertion was that, over time, small stocks outperform large-cap stocks and value stocks, defined as those with a low price/book ratio, outperform expensive stocks – the category typically referred to as growth. A common explanation is that the market should reward investors with higher returns in exchange for the additional risk they take in holding volatile, small-cap and out-of-favor securities.
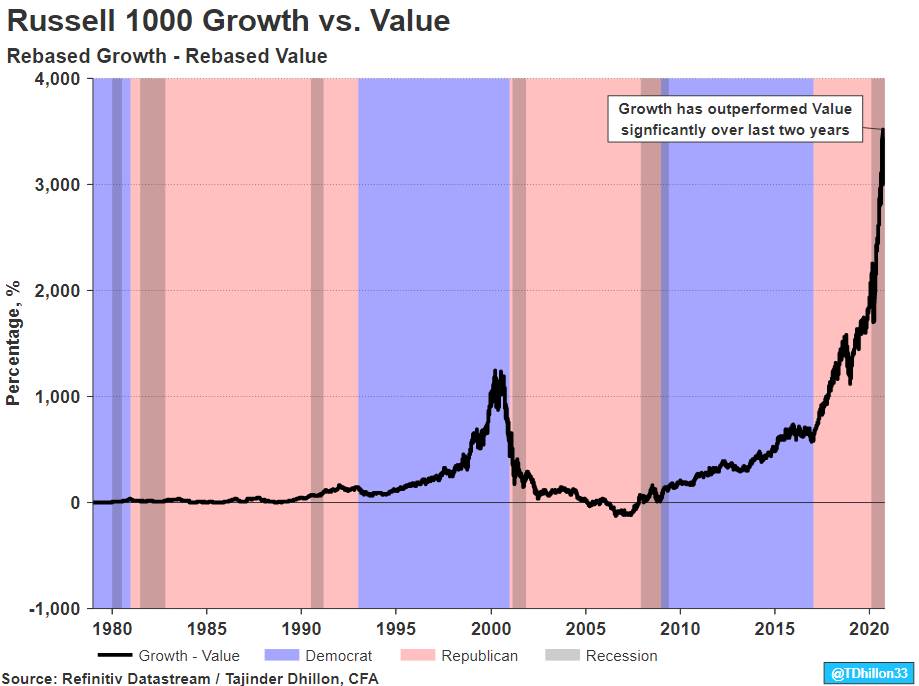
The outperformance of growth vs. value indices
Fama went on to win a Nobel Prize for this work in 2013 – ironically about the time that, as you can see above, growth began to significantly outperform value. The difference in returns between growth and value is now, as you can see, even higher than at the peak of the dot-com bubble – an observation we find rather disturbing. Recent outperformance of growth vs. value is not confined to the U.S. While not shown here, we’ve seen it within Datastream in a comparison of MSCI World Growth vs. Value indices.
Add to that the fact that some of the top performers in both the Russell 1000 Growth Index and the overall market have been some of the largest companies in the world (as we’ll show in Exhibit 2) and the Fama-French model becomes even less convincing.
Reversion to the mean?
So, is the model a fluke of history or, if not, what might change this strong trend of the last few years?
One may simply be reversion-to-the-mean. A pendulum can only swing so far. Strong reversion-to-the-mean tendencies are well documented in the finance literature over a wide variety of phenomenon. We note this in last week’s article titled U.S. Election Chart of the Week – S&P 500 P/E Ratio, which highlights the fact that U.S. stocks are expensive on a forward 12-month P/E basis.
Election year and other calendar effects?
Another may be the election cycle. Regardless of who wins, the market tends to be strong in the months after an election – perhaps since politicians may view it as a mandate to spend on their policy issues and campaign promises. That spending tends to be an economic stimulus. An exception to the outperformance in an election year was in Obama’s first term, as he inherited the global financial crisis. A rotation to smaller, cheaper and more economically cyclical stocks may be even more likely if the Democrats take both the White House and Senate – the thought here being that a larger stimulus package and higher fiscal and infrastructure spending may result.
The calendar also plays a role during most year-end months. The so-called “Santa Claus rally” is sometimes attributed to the end of the “window dressing” and tax-loss selling that funds may do. This year, losses have been more pronounced among value stocks. That opportunity ends at the last trading day of October. You can examine these election cycle and calendar relationships in Exhibit 1.
Exhibit 1: S&P 500 Value Index – Monthly Returns since 2000

Rising regulatory scrutiny?
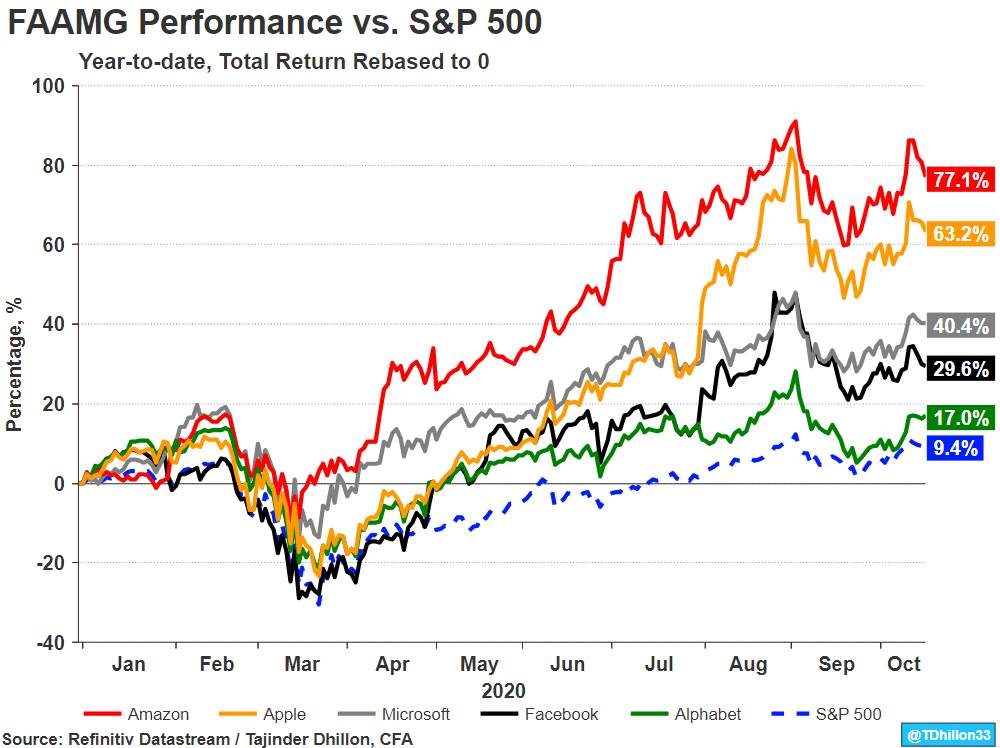
Another election-year outcome that might trigger a shift toward value and smaller company stocks may be more regulation and enforcement actions aimed at some of the largest tech stocks and top market outperformers. Those leaders, until recently called FAANGs, have morphed a bit into FAAMG – Facebook, Amazon, Apple, Microsoft and Google (Alphabet). Their impressive outperformance, relative to the S&P 500, even during just the year-to-date period, is shown in Exhibit 2.
Media reports note that there have been calls to further regulate, or even break-up, companies within this collection of market leaders. Some view their size and market dominance as anti-competitive. These calls seem loudest coming from the EU. The EU is even exploring a “digital tax.”
Exhibit 2: FAAMG Performance vs. S&P 500 Year-to-date
Want more charts and analysis? Access a pre-built library of charts built by Fathom Consulting via Datastream Chartbook in Refinitiv Eikon.
The return of inflation?
The U.S. and many other countries have thrown enormous amounts of stimulus money at both businesses and individuals in an attempt to mitigate some of the economic damage caused by the Covid-19 pandemic. It seems likely that the U.S. federal government may soon send another round of stimulus into the economy – larger under Democrat control and smaller under Republicans.
The total dollar amount is unprecedented, so it’s hard to predict if, or when, this might result in an upturn in inflation. If inflation does return, it’s likely to help recent market laggards and hurt the valuations of recent winners.
One reason for that is the sector bias found in the growth and value indices. Using our earlier example of the Russell 1000 Growth and Value indices, the Growth index is roughly weighted 44% to technology sector stocks, just 2% to financials and barely any to energy. In contrast, the Value index has 18% in financials, 13% industrials and 4% in energy. No wonder it’s lagged. Rising inflation is likely to boost financials and industrials. Bank margins have been badly squeezed in a low interest-rate environment.
Higher inflation is likely to dampen the valuations within the large exposure present in the Growth index. It’s also likely to do the same to the FAAMGs. The reason for this, from a financial theory perspective, is that a company is supposed to have an intrinsic value that’s a function of its stream of cash flows, in perpetuity, discounted back to the present value.
Within that framework, higher inflation hurts the valuation of all long-duration assets. That’s primarily due to a higher discount rate. With it, the math works out so the cash received further into the future is worth less today than near-term cash flows. With tech and other growth stocks, significant and positive free cash flows are often deferred in favor of near-term growth and investment.
Following that line of reasoning, higher inflation may conversely benefit slow-growing cash generating value stocks.
Conclusion
Will any of these scenarios come to pass? It’s very difficult to say. We assume a lot of value fund managers hope so – and soon. For the most part, they’ve been in a world of hurt. Assets under management have dwindled and we’ve seen at least one large and previously successful value hedge fund throw in the towel. That alone may be an indicator. Recall that Julian Robertson shut down Tiger Management in March 2000, citing losses in value stocks. March 2000 was, of course, the peak of the tech bubble. Value stocks outperformed for the decade that followed.
Refinitiv Datastream
Refinitiv Datastream is a financial time series database which allows you to identify and examine trends, generate and test ideas and develop viewpoints on the market.
Refinitiv offers the world’s most comprehensive historical database for numerical macroeconomic and cross-asset financial data that started in the 1950s and has grown into an indispensable resource for financial professionals. Find out more.