During Refinitiv Lipper’s fund-flows week ended June 22, 2022, investors were overall net sellers of fund assets (including both conventional funds and ETFs) for the second straight week, withdrawing a net $20.1 billion.
Taxable bond funds (-$11.2 billion), equity funds (-$5.4 billion), money market funds (-$1.9 billion), and tax-exempt bond funds (-$1.6 billion) all suffered outflows.
Index Performance
At the close of Refinitiv Lipper’s fund-flows week, U.S. broad-based equity indices traded negative for the second week straight—Russell 2000 (2.36%), S&P 500 (-0.79%), DJIA (-0.60%), and Nasdaq (-0.42%)
Fixed income indices traded positive for the first week in three, with the Bloomberg Municipal Bond Total Return Index and the Bloomberg U.S. Aggregate Bond Total Return Index rising 0.32% and 0.73%, respectively.
Overseas broad market indices posted sub-zero performance for the second straight week— Nikkei 225 (-1.60%), Shanghai Composite (-1.12%), Dax 30 (-0.79%), and FTSE 100 (-0.58%).
Rates/Yields
The 10-two Treasury yield spread fell over the week (-13.79%). Treasury yields along the yield curve fell—the two- (-6.80%), five- (-6.98%), 10- (-7.04%), and 30-year (-4.87%).
The Mortgage Bankers Association reported the 30-year fixed-rate average increased by its largest weekly margin since 2009 to 5.89%. This is also the highest fixed-rate average since November 2008. The United States Dollar Index (DXY, -0.91 %) depreciated as the VIX (+17.24%) increased over the course of the week.
Market Recap
Our fund-flows week kicked off Thursday, June 16, one day after the Federal Reserve implemented its largest interest rate hike since 1994. The Fed also signaled that another 75-basis point (bps) increase is a real possibility at their July meeting. U.S. broad-based equity markets tumbled on the day—Russell 2000 (-4.70%), Nasdaq (-4.08%), S&P 500 (-3.25%), and DJIA (-2.42%). Market participants rushed into Treasuries as yields fell on the day, led by the two-(-3.69%) and five-year (-2.82%). The Department of Commerce reported that construction on new homes fell by the largest one-month rate in more than two years (-14.4%). The Bank of England also has been in a rate-raising mood, as it increased interest rates for the fifth time in a row.
U.S. equity indices ended the calendar week on June 17 gaining back some of the previous day losses—Nasdaq (+1.43%) and Russell (+0.96%) led the way. The slight gains could not stop equity markets from realizing their third straight calendar week decline. Treasury yields fell for the third straight day with the 30-year yield falling 1.99%. A survey of corporate executives done by the Conference Board showed that 60% of CEOs predict a recession sometime within the next 12 to 18 months. The same survey at the end of 2021 showed 22% shared a recessionary outlook.
On Monday, June 20, U.S. markets were closed in recognition of Juneteenth.
On Tuesday, June 21, U.S. equity markets reported strong gains across the board—Nasdaq (+2.51%), S&P 500 (+2.45%), DJIA (+2.15%), and Russell 2000 (+1.70%). Treasury markets saw a selloff for the first session in four, with the 10-year Treasury yield jumping 2.04%. The National Association of Realtors (NAR) reported that existing home sales fell 3.4% from last month, marking the fourth straight monthly decline. Existing home sales fell to 5.41 million, which is the lowest total since June 2020. NAR also stated that the median price for existing homes moved to more than $400,000 for the first time on record.
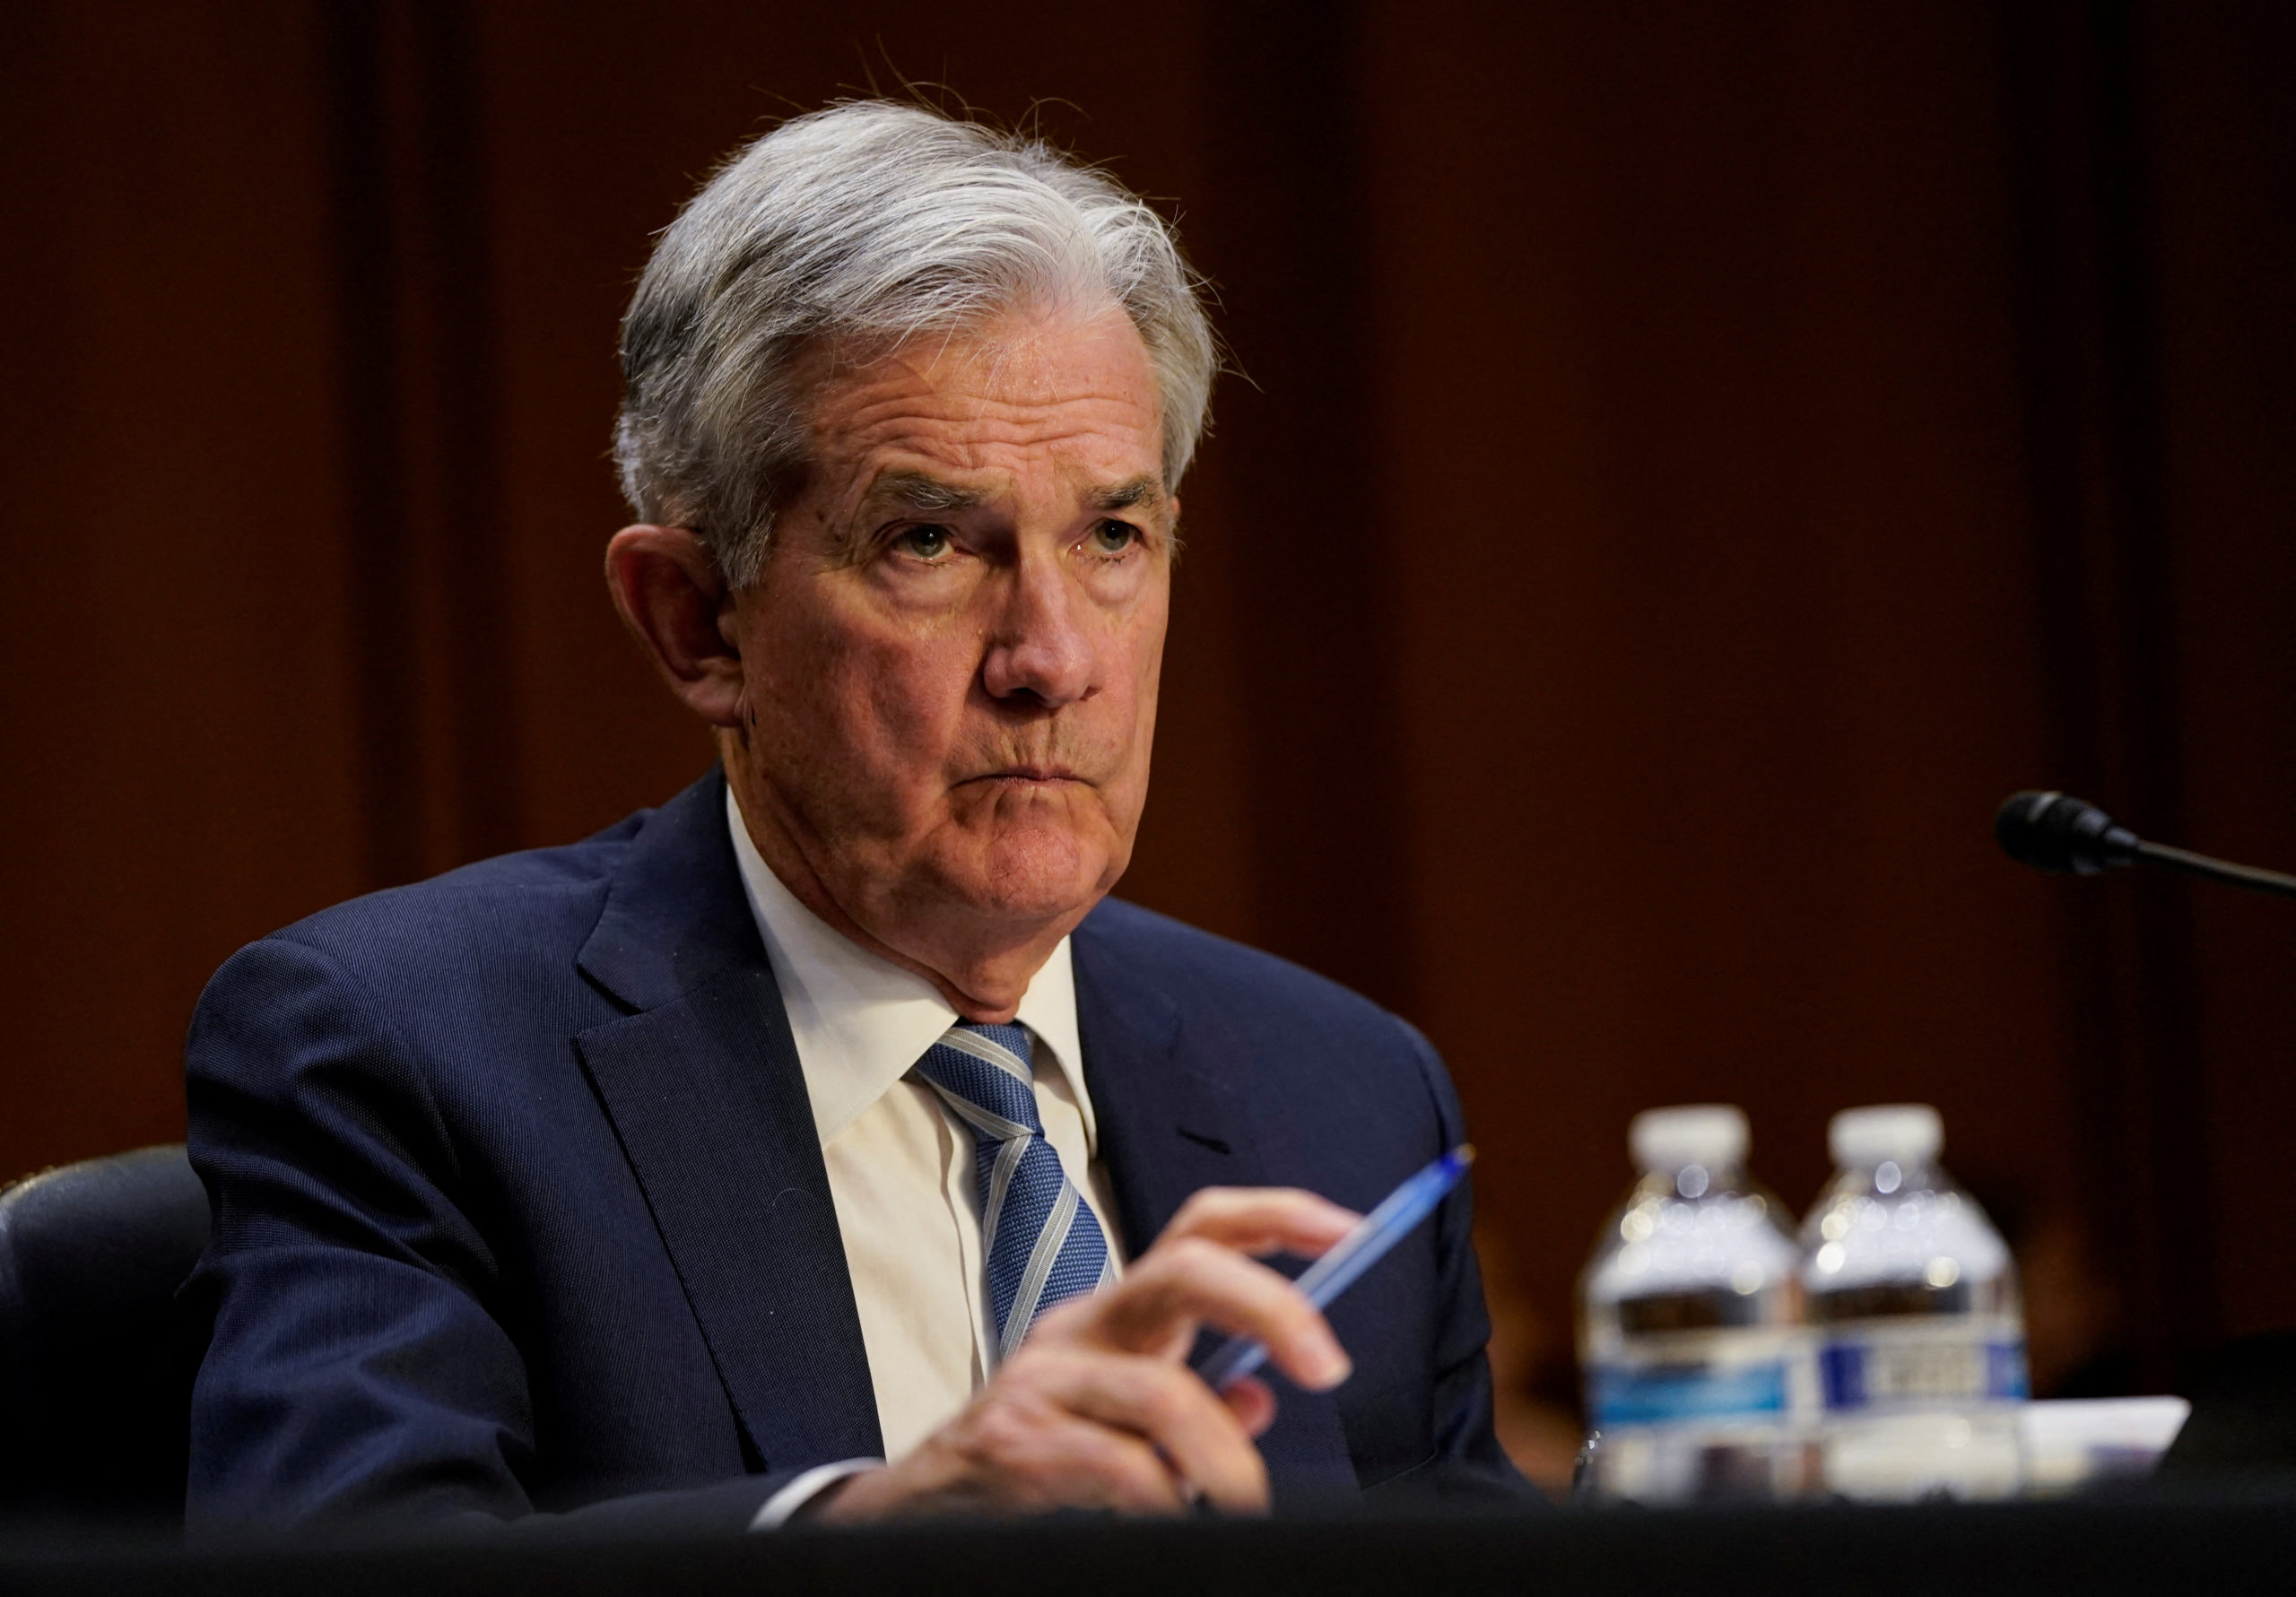
Our fund-flows week wrapped up Wednesday, June 22, with Federal Reserve Chair Jerome Powell once again in the limelight. Powell testified in front of the Senate Banking Committee, where he reiterated the Fed remains “strongly committed” to bringing inflation back down to 2%. Powell said a recession is “certainly a possibility” and goes on to say, “(The Fed) are not trying to provoke and do not think we will need to provoke a recession, but we do think it’s absolutely essential” to tame inflationary pressures. Equity markets traded slightly down as investors continued to buy Treasuries—10-year Treasury yield fell 4.51% to 3.16%.
Exchange-Traded Equity Funds
Exchange-traded equity funds recorded $386 million in weekly net outflows, marking their second weekly outflow in a row. The macro-group posted a negative return of 1.45% on the week.
Sector-other ETFs (-$1.4 billion), sector-energy ETFs (-$1.2 billion), and sector-financial/banking (-$978 million) were the top flow detractors under the macro-group. Sector-other ETFs reported a negative 1.04% on the week as they logged their second weekly outflow in three. Sector-energy ETFs suffered their sixth-largest weekly outflow on record as they realized a negative 8.92% over the week.
Growth/value-large cap ETFs (+$5.8 billion), convertible & preferreds ETFs (+$76 million), and sector-technology ETFs (+$62 million) were the only equity ETF subgroups to post inflows this week. Growth/value-large cap ETFs observed their sixth weekly inflow over the previous seven weeks. The subgroup’s four-week flow moving average has been more than $2.5 billion for five straight weeks.
Over the past fund-flows week, the top three equity ETF flow attractors were SPDR S&P 500 ETF (SPY, +$5.5 billion), iShares: Core S&P Total US Market ETF (ITOT, +$1.5 billion), and SPDR S&P Biotech ETF (XBI, +$609 million).
Meanwhile, the bottom three equity ETFs in terms of weekly outflows were iShares: Core S&P 500 ETF (IVV, -$1.1 billion), Select Sector: Energy SPDR (XLE, -$871 million), and Select Sector: Financial Sector ETF (XLF, -$695 million).
Exchange-Traded Fixed Income Funds
Exchange-traded fixed income funds observed a net $1.5 billion weekly outflow—the macro-group’s second consecutive week of outflows. Fixed income ETFs reported a weekly return of positive 0.24% on average—the macro-group’s first week of positive performance in four. The four-week flow moving average dropped to negative (-$323 million) for the first time since March.
Corporate-investment grade ETFs (-$1.9 billion), corporate-high yield ETFs (-$1.6 billion), and international & global debt ETFs (-$509 million) were the largest detractors under taxable fixed income ETFs. Corporate-investment grade ETFs suffered their second straight weekly outflow as they realized their four-week flow moving average surpass negative 1.0 billion for the first time since April 2020.
Government-Treasury ETFs (+$3.2 billion) were the only subgroup to log weekly inflows under taxable fixed income ETFs. This subgroup has attracted new capital in nine of the past 11 weeks.
Municipal bond ETFs reported a $422 million inflow over the week, marking their first weekly inflow in three weeks. The subgroup realized a positive 0.36% on average.
SPDR Bloomberg 1-3 Month T-Bill (BIL, +$919 million) and iShares: 7-10 Treasury Bond ETF (IEF, +$555 million) attracted the largest amounts of weekly net new money for taxable fixed income ETFs.
On the other hand, iShares: iBoxx $Investment Grade Corporate ETF (LQD, -$1.0 billion) and iShares: iBoxx $High Yield Corporate ETF (HYG, -$755 million) suffered the largest weekly outflows under all taxable fixed income ETFs.
Conventional Equity Funds
Conventional equity funds (ex-ETFs) witnessed weekly outflows (-$5.1 billion) for the twentieth straight week. Conventional equity funds posted a weekly return of negative 1.42%, marking their second consecutive week of sub-zero performance.
International equity (-$1.8 billion), global equity (-$624 million), and growth/value-small cap funds (-$571 million) were the largest subgroup outflows under conventional equity funds for the second straight week. International equity conventional funds have suffered 10 straight weeks of outflows, all greater than $1.4 billion. The subgroup also suffered a negative return of 2.04% on the week. Conventional global equity funds have reported 20 straight weeks of outflows.
There were no subgroup weekly inflows under conventional equity funds.
Conventional Fixed Income Funds
Conventional taxable-fixed income funds realized a weekly outflow of $9.7 billion—marking their twenty-second straight week of outflows. The subgroup has produced a negative four-week flow moving average of at least $1.3 billion in 21 consecutive weeks. The macro-group recorded a negative 0.21% on average—their third straight week of sub-zero performance.
Corporate-investment grade (-$5.5 billion), flexible funds (-$1.6 billion), corporate-high yield ($1.0 billion), and balanced funds (-$771 million) led the macro-group in outflows. Conventional corporate-investment grade funds have now suffered 19 consecutive weeks of outflows; each of which has been larger than $1.5 billion. The subgroup has posted a positive weekly performance of 0.28%, marking only the second time of plus-side performance in the last 16 weeks.
There were no subgroup weekly inflows under conventional taxable fixed income funds.
Municipal bond funds (ex-ETFs) returned a positive 0.28% over the fund-flows week—their first positive performing week in three. The subgroup experienced $2.1 billion in outflows, marking its twenty-third week of outflows in 24. The subgroup has logged 21 straight weeks with a four-week moving outflow average of greater than $1.1 billion. Conventional municipal bond funds only recorded five total weeks of net outflows in all of 2021.
Refinitiv Lipper delivers data on more than 330,000 collective investments in 113 countries. Find out more.
Join a growing community of asset managers and stay up to date with the latest research from Refinitiv and partners to help you inform your investment decisions. Follow our Asset Management LinkedIn showcase page.